


Which cities and towns in England and Wales are the safest?
Taking a stroll along your local high street is one of life’s little pleasures, whether you’re doing some shopping or meeting a friend. Often, safety is the last thing on your mind when doing your daily activities, but do you ever wonder exactly how safe you are in your hometown?
Many professionals practise safety every day as part of their work duties. At Get Licensed, we offer high-quality security training courses, including the SIA Door Supervisor course, to help learners get licensed by the SIA. We also assist them in finding relevant security jobs.
To ease your mind and pique your interest, we want to analyse English and Welsh towns and cities on their safety by digging into crime rate data. We will look at the different crimes committed in these areas, from thefts to violent crimes.
We will also combine this with CCTV data to show which towns and cities could benefit from closer surveillance to feel safer in their communities.
This research will also reveal tips and tricks from our experts on protecting yourself and your business. Stay tuned to find out which are the safest cities in the UK.
The Safest Towns and Cities in England and Wales
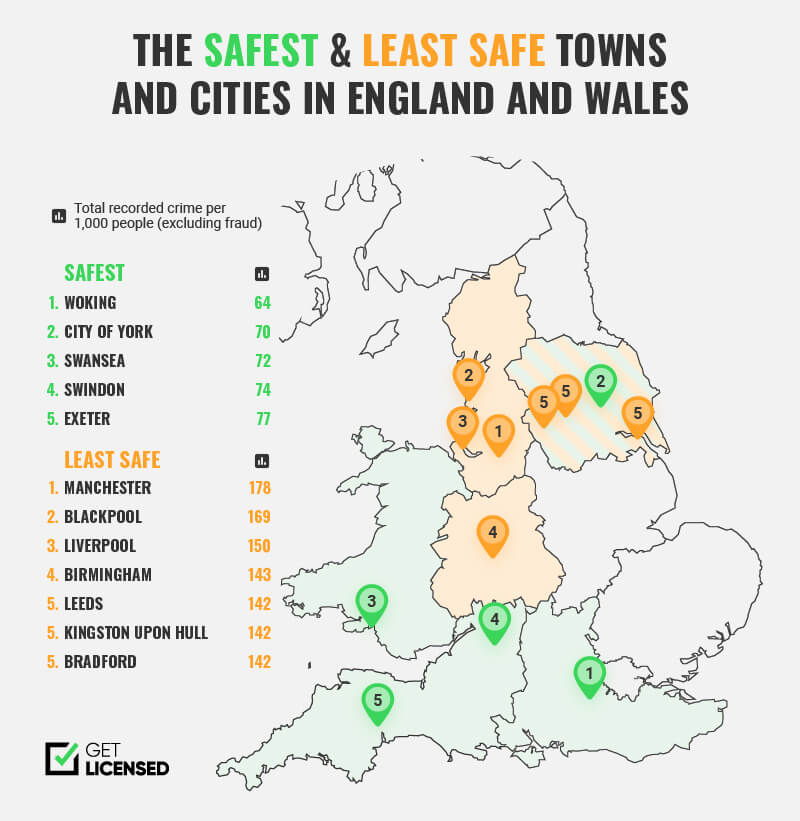
To find the safest towns and examine the lowest crime rate cities in the UK, we looked at crime rates from the Office for National Statistics in England & Wales. The recorded crimes were taken from the year ending September 2022 and included categorically different offences including public order offences, violence against the person, criminal damage and arson and more. The total recorded crimes is the total of every crime recorded, excluding fraud.
| Rank | City | Region | Violence against the person per 1,000 | Sexual offences per 1,000 | Robbery per 1,000 | Theft offences per 1,000 | Criminal damage and arson per 1,000 | Drug offences per 1,000 | Possession of weapons offences per 1,000 | Public order offences per 1,000 | Miscellaneous crimes against society per 1,000 | Total recorded crime(excluding fraud) per 1,000 |
| 1 | Woking | South East England | 25 | 3 | 0 | 17 | 6 | 2 | 0 | 8 | 1 | 64 |
| 2 | City of York | Yorkshire & The Humber | 27 | 3 | 1 | 21 | 8 | 2 | 0 | 7 | 1 | 70 |
| 3 | Swansea | Southwest Wales | 29 | 3 | 0 | 19 | 8 | 2 | 0 | 10 | 1 | 72 |
| 4 | Swindon | South West England | 31 | 3 | 1 | 19 | 8 | 2 | 1 | 7 | 1 | 74 |
| 5 | Exeter | South West England | 32 | 4 | 1 | 19 | 9 | 4 | 1 | 6 | 2 | 77 |
| 6 | Worthing | South East England | 29 | 3 | 1 | 28 | 9 | 3 | 1 | 10 | 1 | 85 |
| 7 | Warrington | North West England | 40 | 4 | 1 | 18 | 7 | 2 | 0 | 13 | 2 | 86 |
| 8 | Chelmsford | East of England | 36 | 3 | 1 | 27 | 8 | 3 | 1 | 9 | 2 | 88 |
| 9 | Plymouth | South West England | 41 | 5 | 1 | 16 | 10 | 5 | 2 | 7 | 2 | 89 |
| 10 | Watford | East of England | 33 | 3 | 1 | 37 | 8 | 2 | 1 | 6 | 1 | 92 |
- Woking, Surrey
Total recorded crimes per 1,000 people: 64
Woking, a town in Surrey, had by far the lowest recorded crimes at 64 per 1,000 people. One of the largest towns in Surrey, Woking is known as the landing place for the aliens in H. G. Wells’ The War of the Worlds. The town boasts the UK’s oldest mosque, the Shah Jahan and motorsport legends McLaren.
Woking recorded low levels of crime for burglary offences (3 per 1,000) and theft offences (17 per 1,000). There were also comparatively low levels of violence with injury offences (7 per 1,000), contributing to its reputation as one of the safest cities in the UK.
- York, North Yorkshire
Total recorded crimes per 1,000 people: 70
York, a walled city in northeast England that was founded by the ancient Romans, had among the lowest total recorded crimes at 70 per 1,000 people. York is known for its historical sites, including York Minister and its huge 13th-century cathedral.
Crime rates in York are particularly low and had among the lowest sexual offence cases out of all cities (3 per 1,000 people). The city also scored low for its offences related to public order offences (7 per 1,000) as well as drug offences (2 per 1,000), making it one of the safest cities in the UK.
- Swansea, Wales
Total recorded crimes per 1,000 people: 72
Swansea, a city and county on the south coast of Wales, also scored low for its total recorded crimes at 72 per 1,000 people. Swansea is the second largest city in Wales and is known for its legendary nightlife and as the birthplace of poet Dylan Thomas.
Swansea had low crime rates across all factors, with a low number of violence against the person offences (29 per 1,000), and sexual offences (3 per 1,000).
- Swindon, Wiltshire
Total recorded crimes per 1,000 people: 74
Swindon, a town in southwest England, had the third lowest total recorded crimes at 74 per 1,000 people. Swindon is known for its STEAM – Museum of the Great Western Railway, set in a restored station. The large town in Wiltshire has a fast-growing population of 222,900 people.
Swindon had low crime rates across all mediums, notably for its possession of weapon offences (1 per 1,000), sexual offences (3 per 1,000), as well as robbery offences (1 per 1,000).
- Exeter, Devon
Total recorded crimes per 1,000 people: 77
Exeter is an ancient city on the River Exe in southwest England, known for its historical gothic cathedral and prestigious university. Exeter came in fifth place with a total of 77 recorded crimes per 1,000 people.
Exeter had low levels of miscellaneous crimes against society (2 per 1,000) and also scored low for its robberies (1 per 1,000). There were also low levels of crime related to drug offences (4 per 1,000).
The Least Safe Towns and Cities in England and Wales
We have explored the safest cities in UK above, so it is only fair to take a closer look at the cities and towns at the other end of the scale. The below cities had the highest number of total crimes recorded by population size.
| Rank | City | Region | Violence against the person per 1,000 | Sexual offences per 1,000 | Robbery per 1,000 | Theft offences per 1,000 | Criminal damage and arson per 1,000 | Drug offences per 1,000 | Possession of weapons offences per 1,000 | Public order offences per 1,000 | Miscellaneous crimes against society per 1,000 | Total recorded crime(excluding fraud) per 1,000 |
| 1 | Manchester | North West England | 62 | 6 | 4 | 57 | 15 | 5 | 2 | 24 | 4 | 178 |
| 2 | Blackpool | North West England | 76 | 6 | 2 | 42 | 20 | 3 | 2 | 13 | 4 | 169 |
| 3 | Liverpool | North West England | 57 | 4 | 2 | 35 | 13 | 12 | 1 | 23 | 3 | 150 |
| 4 | Birmingham | West Midlands | 61 | 5 | 4 | 40 | 11 | 3 | 3 | 13 | 2 | 143 |
| 5 | Leeds | Yorkshire & The Humber | 56 | 4 | 2 | 40 | 13 | 4 | 1 | 19 | 3 | 142 |
| 5 | Kingston upon Hull | Yorkshire & The Humber | 54 | 5 | 1 | 40 | 17 | 2 | 1 | 18 | 4 | 142 |
| 5 | Bradford | Yorkshire & The Humber | 64 | 4 | 1 | 29 | 14 | 4 | 1 | 20 | 3 | 142 |
| 8 | Southampton | South East England | 59 | 6 | 1 | 36 | 12 | 4 | 2 | 17 | 2 | 140 |
| 9 | Leicester | East Midlands | 53 | 5 | 1 | 35 | 14 | 5 | 1 | 19 | 3 | 136 |
| 10 | Wolverhampton | West Midlands | 62 | 4 | 2 | 36 | 11 | 3 | 2 | 13 | 3 | 135 |
- Manchester, Greater Manchester
Total recorded crimes per 1,000 people: 178
Manchester, a major city and unitary authority in the northwest of England with a rich industrial heritage, policed by Greater Manchester, came in first place, with 178 total recorded crimes per 1,000 people.
Manchester recorded extremely high crime levels, especially its theft offences (57 per 1,000 people) which were the highest on our list, and public order offences (24 per 1,000). The city also had high counts of violence without injury offences (28 per 1,000).
- Blackpool, Lancashire
Total recorded crimes per 1,000 people: 169
Blackpool, a coastal town in Lancashire, England, came in fourth place for the least safe local authorities, with 169 total recorded crimes per 1,000 people.
Blackpool recorded the highest levels of crime for its violence against the person offences (76 per 1,000 people) and scored high for its theft offences (42 per 1,000). There were also comparatively high levels of criminal damage and arson offences (20 per 1,000 people).
- Liverpool, Merseyside
Total recorded crimes per 1,000 people: 150
Liverpool, a maritime city in northwest England, with a large population of 500,500 people. It is famously the hometown of the Beatles and its football club.
Policed by Merseyside, Liverpool had high counts of recorded crime for the 12 months recorded. Most notably, its violence against the person attacks (57 per 1,000 people), theft offences (35 per 1,000) and criminal damage and arson attacks (13 per 1,000 people.)
- Birmingham, West Midlands
Total recorded crimes per 1,000 people: 143
Birmingham, a major city in the West Midlands region scored high for its levels of crime when compared to the population, with 143 total crimes. Birmingham is home to its leading global university and prides itself as one of the country’s principal industrial and commercial areas.
Birmingham recorded high levels of violence against the person offences (61 per 1,000) and scored high for its theft offences (40 per 1,000) as well as violence with injury reports (16 per 1,000).
- Leeds, Bradford and Kingston upon Hull
Total recorded crimes per 1,000 people: 142
In joint fifth place are three Yorkshire cities, with Leeds and Bradford only eight miles apart. The city of Leeds is a hub for art and music, while Bradford is the world’s first UNESCO City of Film. Kingston upon Hull was the UK City of Culture in 2017.
Leeds, Bradford and Hull recorded 142 crimes per 1,000 people. Leeds reported 56 counts of violence against the person, Bradford reported 64, and Kingston upon Hull recorded 54 (per 1,000).
The Safest London Boroughs
We also looked at the safest Boroughs in London to accurately compare the total recorded crime levels for each London Borough, assessing London crime rates in the process.
| Rank | Borough | Local Authority name | Violence against the person per 1,000 | Sexual offences per 1,000 | Robbery per 1,000 | Theft offences per 1,000 | Criminal damage and arson per 1,000 | Drug offences per 1,000 | Possession of weapons offences per 1,000 | Public order offences per 1,000 | Miscellaneous crimes against society per 1,000 | Total recorded crime(excluding fraud) per 1,000 |
| 1 | Richmond upon Thames | Richmond upon Thames | 15 | 2 | 1 | 28 | 5 | 2 | 0 | 4 | 1 | 58 |
| 2 | Harrow | Harrow | 20 | 2 | 2 | 27 | 4 | 3 | 0 | 5 | 1 | 64 |
| 3 | Bexley | Bexley | 23 | 2 | 1 | 23 | 6 | 3 | 0 | 5 | 1 | 65 |
| 4 | Sutton | Sutton | 21 | 2 | 1 | 28 | 6 | 3 | 0 | 5 | 1 | 67 |
| 4 | Merton | Merton | 21 | 2 | 2 | 28 | 5 | 3 | 0 | 5 | 1 | 67 |
| 6 | Barnet | Barnet | 20 | 2 | 2 | 33 | 5 | 3 | 0 | 5 | 1 | 69 |
| 7 | Kingston upon Thames | Kingston upon Thames | 21 | 3 | 1 | 29 | 5 | 5 | 1 | 5 | 1 | 70 |
| 8 | Bromley | Bromley | 21 | 2 | 1 | 30 | 6 | 4 | 1 | 6 | 1 | 71 |
| 9 | Havering | Havering | 24 | 2 | 1 | 30 | 6 | 4 | 1 | 5 | 1 | 74 |
| 10 | Wandsworth | Wandsworth | 23 | 3 | 2 | 34 | 5 | 3 | 1 | 5 | 1 | 77 |
- London Borough of Richmond upon Thames
Total recorded crimes (excluding fraud) per 1,000: 58
The London Borough of Richmond upon Thames recorded the least crimes for the year ending September 2022, with a total of 58 crimes per 1,000 people. The residential district, bordering the River Thames, attracts botanical enthusiasts with its green spaces and large Arboretum.
Richmond upon Thames recorded low levels of crime across all offences, particularly for homicide, death or serious injury caused by illegal driving and possession of weapon offences, of which there were none reported. There were low levels of residential burglaries (3 per 1,000), as well as thefts (from the person), at 1 per 1,000 people.
- London Borough of Harrow
Total recorded crimes (excluding fraud) per 1,000: 64
Harrow, the principal settlement of the London Borough of Harrow, came in second place for the safest London boroughs, with a total of 64 crimes (excluding fraud) per 1,000 people.
Harrow is famed for its prestigious boarding school, whose former pupils include Winston Churchill, Jawaharlal Nehru, the first prime minister of India, and James Blunt.
Harrow recorded low levels of crime despite its larger population (252,300 people) compared to others in the top five safest Boroughs. Particularly, there were low records of violence with injury offences (6 per 1,000), criminal damage and arson attacks (4 per 1,000), and drug offences (3 per 1,000).
- London Borough of Bexley
Total recorded crimes (excluding fraud) per 1,000: 65
Bexley is a London Borough in south-east London, which is known for its large open spaces of woodlands and nature reserves, with Kent’s rolling hills in the distance.
The historical Borough of Bexley recorded low levels of crime, including its sexual offences (2 per 1,000), vehicle offences (9 per 1,000), and shoplifting offences (3 per 1,000).
- London Borough of Sutton
Total recorded crimes (excluding fraud) per 1,000: 67
Sutton is a London Borough in south-west London, known for its Royal Marsden Hospital and the Institute of Cancer Research, and for being among the highest performing education authorities in the country. Sutton scored in fourth place for the safest London Boroughs, with 67 crimes recorded per 1,000 people.
The London Borough of Sutton recorded low counts of sexual offences (2 per 1,000), vehicle offences (10 per 1,000), and criminal damage and arson (6 per 1,000).
4. London Borough of Merton
Total recorded crimes (excluding fraud) per 1,000: 67
The London Borough of Merton came in joint fourth place with Sutton for the safest Boroughs, with 67 total recorded crimes. Merton, a Borough in Southwest London, is home to the world-famous All England Lawn Tennis Club, where the Wimbledon Championship takes place every year.
Merton recorded low levels of burglaries (5 per 1,000), vehicle offences (9 per 1,000), and drug offences (3 per 1,000).
The Least Safe London Boroughs
We will now look at the London Boroughs with the highest total recorded crime rates (excluding fraud) per 1,000 of the population.
| Rank | London Borough | Local Authority name | Violence against the person | Sexual offences | Robbery | Theft offences | Criminal damage and arson | Drug offences | Possession of weapons offences | Public order offences | Miscellaneous crimes against society | Total recorded crime(excluding fraud) per 1,000 |
| 1 | Westminster | Westminster | 44 | 7 | 12 | 166 | 8 | 13 | 2 | 14 | 2 | 266 |
| 2 | Kensington and Chelsea | Kensington and Chelsea | 28 | 3 | 4 | 76 | 7 | 6 | 1 | 9 | 1 | 135 |
| 3 | Camden | Camden | 25 | 3 | 4 | 69 | 6 | 6 | 1 | 8 | 1 | 122 |
| 4 | Hammersmith and Fulham | Hammersmith and Fulham | 31 | 3 | 3 | 58 | 7 | 5 | 1 | 9 | 1 | 117 |
| 5 | Hackney | Hackney | 30 | 4 | 5 | 55 | 6 | 6 | 1 | 8 | 1 | 116 |
| 6 | Islington | Islington | 29 | 3 | 4 | 55 | 6 | 5 | 1 | 9 | 1 | 112 |
| 7 | Haringey | Haringey | 31 | 3 | 5 | 49 | 7 | 5 | 1 | 8 | 1 | 110 |
| 8 | Southwark | Southwark | 27 | 3 | 5 | 53 | 6 | 6 | 1 | 7 | 1 | 109 |
| 9 | Lambeth | Lambeth | 30 | 4 | 4 | 44 | 7 | 6 | 1 | 8 | 1 | 106 |
| 10 | Tower Hamlets | Tower Hamlets | 30 | 3 | 3 | 45 | 6 | 7 | 1 | 7 | 1 | 105 |
- City of Westminster
Total recorded crimes (excluding fraud) per 1,000: 266
The City of Westminster, a city and borough in Inner London, had the highest levels of total recorded crimes out of the 32 London Boroughs, with 266 crimes per 1,000 people. Westminster is known as the site of the Houses of Parliament and the British government.
Westminster recorded shocking levels of safety-related crime during the month recorded, including 55 cases of theft (from the person) per 1,000, 16 vehicle offences (per,1000), and 166 theft offences (per 1,000).
- Royal Borough of Kensington and Chelsea
Total recorded crimes (excluding fraud) per 1,000: 135
Kensington and Chelsea is an Inner London borough with royal status. It is also the smallest borough in London and is home to several attractions including Kensington Gardens and the Royal Albert Hall.
Kensington and Chelsea recorded high counts of violence against the person offences (28 per 1,000), violence without injury offences (12 per 1,000), and theft offences (76 per 1,000), despite its small population of 156,900 people.
- London Borough of Camden
Total recorded crimes (excluding fraud) per 1,000: 122
The London Borough of Camden in Inner London, came in third place for the least safe boroughs in London, with 122 total recorded crimes. Camden is known as home to many famous people including Charles Dickens, George Bernard Shaw and JB Priestley.
Camden recorded 69 theft offences (per 1,000), 11 counts of violence without injury (per 1,000), and 25 counts of violence against the person (per 1,000 people).
- London Borough of Hammersmith and Fulham
Total recorded crimes (excluding fraud) per 1,000: 117
Hammersmith and Fulham, a borough in West London which also forms part of Inner London, came in fourth place for the least safe boroughs, with 117 crimes. Known for its historic terraces, community spirit and high-achieving schools, it is also home to great restaurants and waterfront scenery.
However, Hammersmith and Fulham recorded comparatively high levels of crime compared to other boroughs. These included 31 counts of violence against the person (per 1,000), 58 theft offences (per 1,000), and 16 vehicle offences (per 1,000).
- London Borough of Hackney
Total recorded crimes (excluding fraud) per 1,000: 116
The London Borough of Hackney came in fifth place for the safest boroughs in London, with a total of 116 total recorded crimes. Hackney is one of London’s most diverse and unique boroughs, with its unmatched food scene and lively nightlife.
Hackney recorded 55 theft offences (per 1,000), 30 violence against the person offences (per 1,000), and 12 thefts (from the person) per 1,000 people.
UK Towns and Cities with a Lack of CCTV Operation
We decided to explore which towns and cities had a lack of CCTV and could therefore benefit from more security cameras operating in the area. We collected council data from each of our cities aforementioned on their CCTV camera coverage.
| Rank | Local authority | Region | Population | Number of cameras | Cameras per 10,000 people |
| 1 | Maidstone | South East | 173,132 | 29 | 1.7 |
| 2 | Coventry | West Midlands | 379,387 | 77 | 2.0 |
| 3 | Derby | East Midlands | 256,814 | 60 | 2.3 |
| 4 | Nottingham | East Midlands | 337,098 | 79 | 2.3 |
| 5 | Birmingham | West Midlands | 1,140,525 | 284 | 2.5 |
| 6 | Swansea | Wales | 246,563 | 64 | 2.6 |
| 7 | Warrington | North West | 209,397 | 60 | 2.9 |
| 8 | Sunderland | North East | 277,846 | 88 | 3.2 |
| 9 | Newport | Wales | 156,447 | 76 | 4.9 |
| 10 | Oxford | South East | 151,584 | 79 | 5.2 |
Maidstone had the smallest number of CCTV cameras operating within its historical walls. Maidstone had just 29 security cameras operating in the area (1.6 per 10,000), despite having a larger population than other towns with more cameras.
UK Towns and Cities with the Most CCTV Operation
| Rank | Local authority | Region | Population | Number of cameras | Cameras per 10,000 people |
| 1 | Portsmouth | South East | 214,692 | 2,101 | 97.9 |
| 2 | Blackpool | North West | 138,381 | 819 | 59.2 |
| 3 | Woking | South East | 100,008 | 544 | 54.4 |
| 4 | Wolverhampton | West Midlands | 264,407 | 1,153 | 43.6 |
| 5 | Swindon | South West | 222,881 | 914 | 41.0 |
| 6 | Middlesbrough | North East | 141,285 | 548 | 38.8 |
| 7 | Watford | East of England | 96,623 | 306 | 31.7 |
| 8 | Southampton | South East | 252,872 | 767 | 30.3 |
| 9 | Bradford | Yorkshire and the Humber | 542,128 | 1,466 | 27.0 |
| 10 | York | Yorkshire and the Humber | 211,012 | 520 | 24.6 |
Portsmouth had by far the most CCTV security cameras operating within the waterfront city. There are a total of 2,101 cameras installed within the city (97.9 per 100,000) on the lookout for criminal activity. This extensive surveillance contributes to making Portsmouth one of the safest cities in the UK.
Safety Tips and Tricks to be Safe in your Hometown
The hometown you grew up in and once wondered as a child may be seen as a safe haven, but no matter how peaceful you believe your town is, it’s important to be mindful of some of the dangers.
Our experts at Get Licensed have shared safety tips to help you not only feel safe, but practice being safe in the town you live in:
- Secure your bags and valuables on your person
One of the easiest ways to deter thieves is to make personal belongings more difficult to access. Keep your bag on your person, or better still, attach it to a heavy object. For example, if you are on a train and want to take a nap, fix your bag to your seat or to the luggage rack to avoid luggage theft.
- Be observant in crowds and avoid commotion
Any time there is a commotion within a large crowd, steer clear of the area. Thieves are on high alert and sometimes create a disturbance to distract victims, before swiping at personal belongings. Pay special attention when travelling in railway stations or in busy shopping centres. If you’re at a crowder bar, keep an eye out for drink spiking to avoid any unfortunate incidents.
- Keep your money safe
If you are in a local bar or shop, make sure to return bank cards to your purse or wallet immediately after use. Use a purse that is difficult to open, one that zips or snaps shut. If you are walking around and handling a large amount of cash, use a money belt that is strapped to yourself.
Safety Tips For Your Business
After investing time, money and energy into your business, the last thing you want to happen is to lose merchandise and profits to local thieves. Here are some top tips to secure your shop from shoplifters:
- Welcome your customers
Offering a welcome to your customers is imperative to keep an eye on who enters your establishment. Thieves often assess how easy a shop would be to steal from by how soon they are spoken to by a member of staff.
- Map out crime in the area
Keep records of location, dates and times when local criminal activity is happening. Look at CCTV footage of incidents and general behaviour in the area. Take a look at the local town as a whole and install security cameras if needed. You can also invest in CCTV training for your staff.
- Work with a team
If you can, try to ensure there is a larger staff presence, as thieves will see your business as more vulnerable. More faces in a store mean more eyes on potential criminal activity.
- Practice personal safety
Thieves are unpredictable and can sometimes act with aggression. You can’t stop someone from coming into your business, but employers should conduct a risk assessment in conjunction with health and safety directions. Always trust your instincts and only engage a potential shoplifter if it is safe to do so.
Enhancing Safety Through Awareness and Training
Learning more about the safest cities in the UK empowers residents and businesses to make informed decisions. It allows you to explore areas with the lowest crime rates and find the safest place to live in the UK. However, safety is not solely determined by location; it also hinges on proactive measures and proper training.
At Get Licensed, we offer comprehensive SIA courses such as CCTV Operator Training, Door Supervisor Training, and Security Guard Training to equip individuals with the skills needed to maintain safety and security. By obtaining the necessary qualifications and staying vigilant, you can contribute significantly to making your community a safer place. Explore our security training courses and take the first step toward making a difference.
Methodology
We collected the UK’s biggest towns and cities using World Population Review’s Population of Cities in the United Kingdom 2023 to create a seed list of 50 towns and cities.
We looked at the total recorded crimes using the Office for National Statistics’ Recorded Crime Data by Community Safety Partnership Area, using the table for the year ending September 2022 edition. It is important to note that police recorded crime data are not designated as National Statistics.
All of the population data for each city was taken from the ONS data source, and the figure was normalised against the crimes numbers per 1,000 people.
We created a separate section looking at London boroughs to accurately compare each borough’s total crimes. Rates per 1,000 population are not presented for the City of London owing to its small resident population.
We ranked all cities based on their total recorded crimes taken from the above source, which normalises the total recorded crimes against the population (per 1,000 people), to identify the safest cities in the UK.
For CCTV data, we used FOI data collected from local authorities. This was compiled in January 2022.