
 Trustpilot


Despite efforts from the government to make the UK a safer place, crime remains an ever-present part of society. More than six million crimes were reported between June 2022 and June 2023, emphasising the importance of SIA security licence holders.
Some areas of the UK are more dangerous than others. That’s why we’ve looked at violence, theft, drugs, and more to reveal the areas of the UK that record the most crime.
Hartlepool is the most dangerous area of the UK, with a crime score of 9.54/10
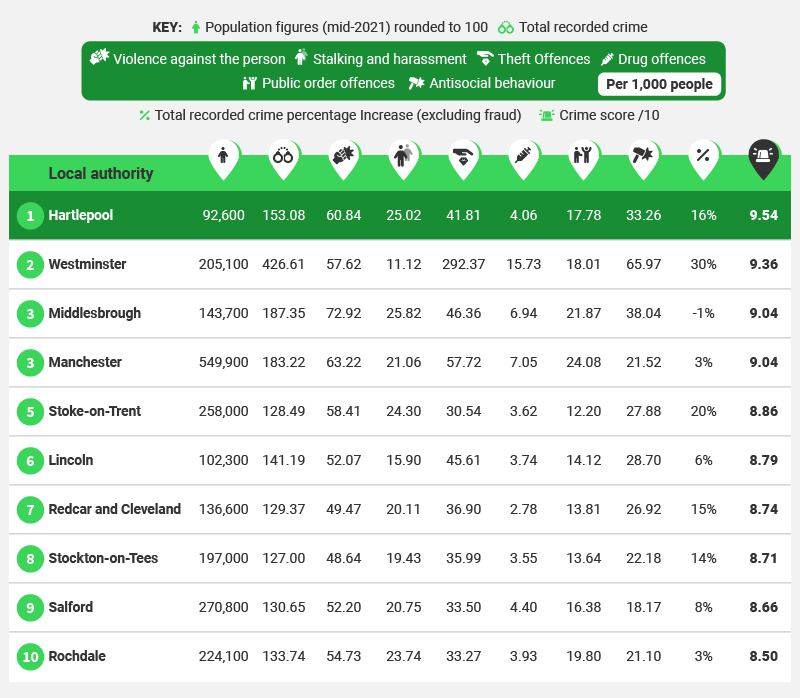
To reveal the crime capitals of the UK, for every local authority, we’ve looked at total recorded crime, the percentage change in crime, and six different crimes per 1,000 people: violence against the person, stalking and harassment, theft, drug offences, public order offences, and antisocial behaviour.
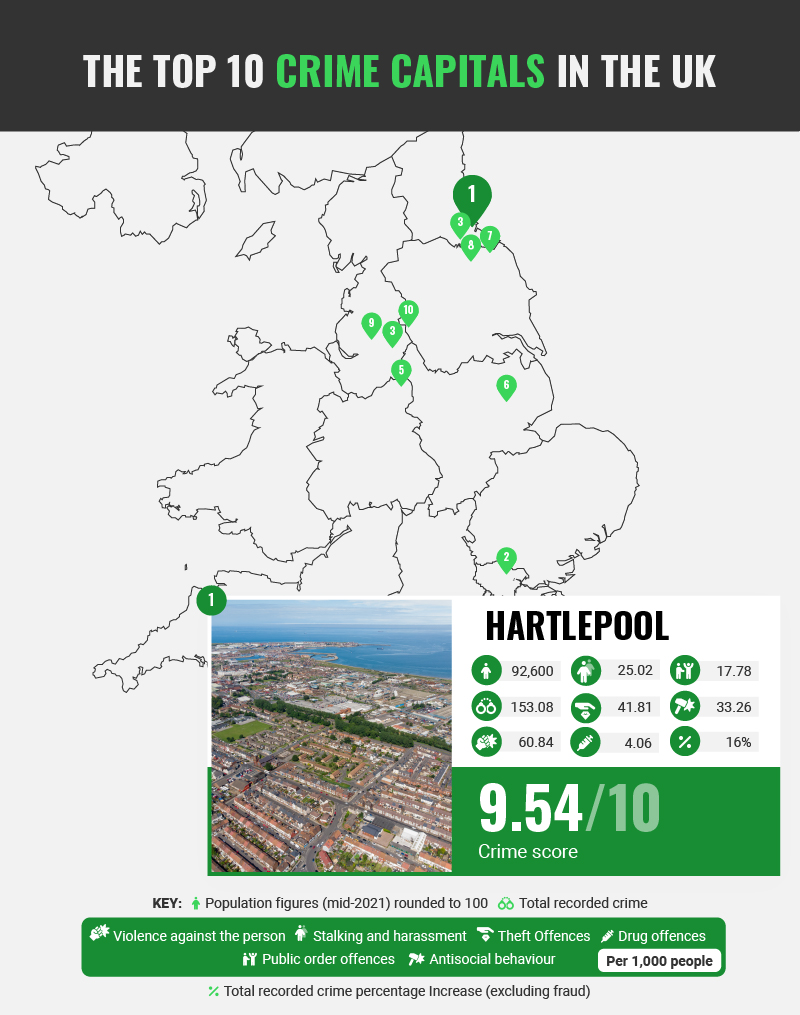
- Hartlepool – 9.54 crime score
Taking the crown as the crime capital of the UK is Hartlepool, with a crime score of 9.54 out of 10. Hartlepool is a consistently high scorer across our categories, ranking in the top 20 local authorities for all but one factor. Crime per 1,000 people in Hartlepool was especially high for stalking and harassment and violence against the person, ranking third and fifth when compared to all local authorities.
- Westminster – 9.36 crime score
Westminster is in second place, with a crime score of 9.36 out of 10. Of our eight categories, Westminster ranks at the top for three – theft offences, drug offences, and total crime per 1,000 people. The only factor that Westminster doesn’t score highly on is stalking and harassment, where it ranks outside the top 100 local authorities.
- Middlesborough/Manchester – 9.04 crime score
Our top three is completed by two local authorities, Middlesborough and Manchester, sharing a crime score of 9.04 out of 10. Both local authorities are consistently high scorers across the board, with Middlesborough and Manchester ranking top for violence against the person and public order offences.
Westminster has recorded more crimes per 1,000 people than any other local authority, with 426 per 1,000
To reveal the prominence of crime in the UK, we’ve looked into the normalised figures of the total crime recorded per local authority.
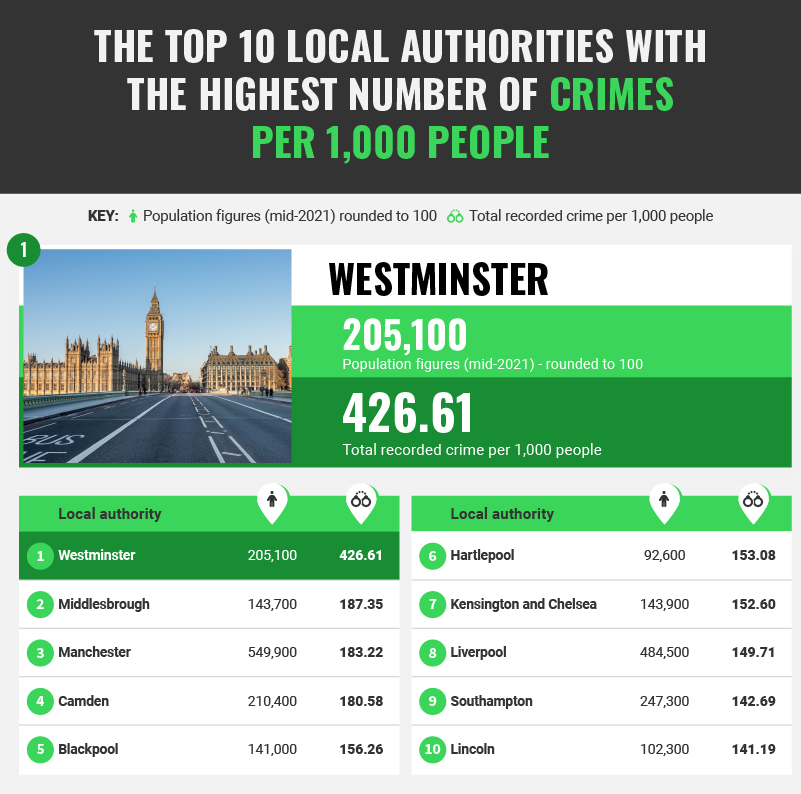
- Westminster – 426.61 total recorded crimes per 1,000 people
Taking the top spot is Westminster, with a total recorded crime of almost 430 per 1,000 people. Just under 70,000 crimes were recorded in total in this London borough, with the most commonly committed crime being theft.
- Middlesbrough – 187.35 total recorded crimes per 1,000 people
In second place is Middlesborough, with almost 190 crimes recorded per 1,000 people. The most commonly committed crime was violence against the person, which was recorded more than 7,000 times in the year ending June 2023. In total, just over 27,000 crimes were committed in Middlesbrough.
- Manchester – 183.22 total recorded crimes per 1,000 people
Completing our top three is Manchester, where 183 crimes were recorded per 1,000 people. In Manchester, more than 100,000 crimes were recorded in total between March 2022 and March 2023, equating to more than 8,000 a month. The most common offence in Manchester was theft, recorded 31,000 times in 12 months.
Middlesbrough is the most violent area of the UK, with 73 reports of violence against the person per 1,000 people
Violence against the person is one of the most prevalent crimes committed in the UK. But which areas of the UK are most responsible for this? Below, we reveal the areas of the UK with the most reports of violence against the person per 1,000 people.
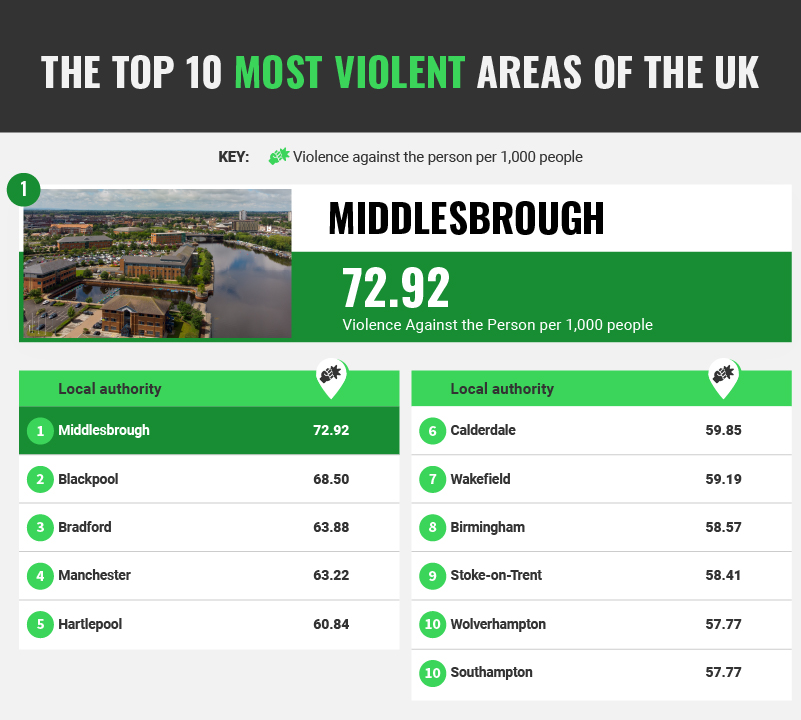
- Middlesbrough – 72.92 reports of violence against the person per 1,000 people
With just under 73 reports of violence against the person, Middlesborough takes the crown as the most violent area of the UK. Violence against the person was the most prevalent crime in Middlesbrough, which was committed more than 10,000 times in 12 months.
- Blackpool – 68.5 reports of violence against the person per 1,000 people
In second place is Blackpool, with just under 70 reports of violence against the person per 1,000. Similarly to Middlesbrough, violence against the person was the most common crime committed in Blackpool, reported almost 10,000 times in total. Almost half of all crimes in Blackpool were violence against the person.
- Bradford – 63.88 reports of violence against the person per 1,000 people
Our top three is completed by Bradford, with 64 reports of violence against the person per 1,000 people. Violence against the person was committed a total of 35,000 times in Bradford in just 12 months, which is the third-highest total for any local authority in the UK.
Bradford has more stalkers than any other area of the UK, with 26.58 stalking and harassment crimes committed per 1,000 people
Between June 2022 and June 2023, there were more than one million cases of stalking and harassment in the UK. That’s why we’ve revealed the areas of the UK with the most stalking and harassment cases per 1,000 people.
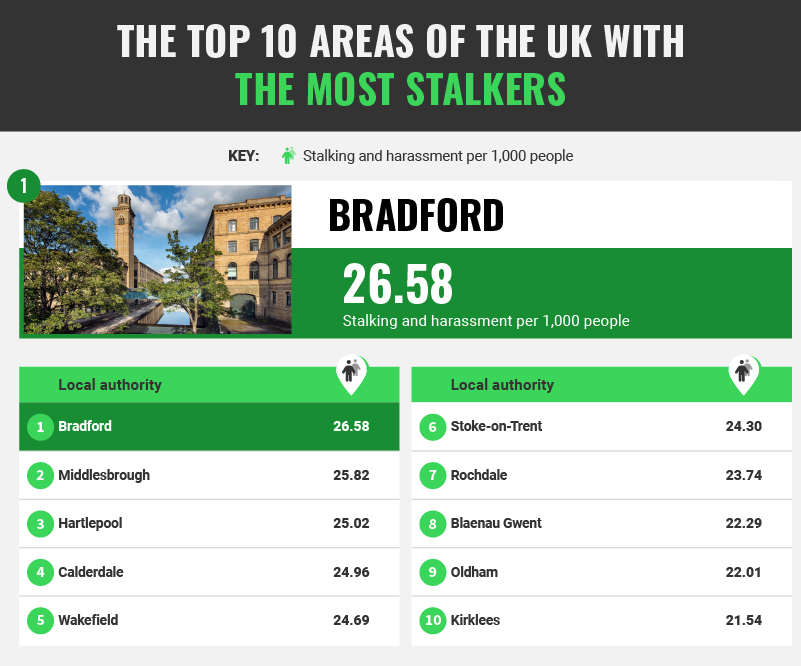
- Bradford – 26.58 stalking and harassment crimes committed per 1,000 people
Taking the top spot is Bradford, with 27 reports of stalking and harassment per 1,000 people. In total, stalking and harassment crimes were committed almost 15,000 times in just 12 months. Bradford’s total is the third highest in the UK, behind only Birmingham and Leeds.
- Middlesbrough – 25.82 stalking and harassment crimes committed per 1,000 people
With just under 26 stalking and harassment crimes committed per 1,000, Middlesbrough takes second place. Stalking and harassment is one of the most prevalent crimes in Middlesbrough, with just three crimes occurring more frequently in this north-east city. In total, stalking and harassment was reported 3,711 times.
- Hartlepool – 25.02 stalking and harassment crimes committed per 1,000 people
Hartlepool completes our top three with 25 reports of stalking and harassment per 1,000 people. Stalking and harassment is the third most common crime committed in Hartlepool, which has been reported more than 2,300 times in total. Only violence against the person and theft occurs more frequently.
Westminster is the theft capital of the UK, with almost 300 cases of theft per 1,000 people
With the cost of living crisis, it’s no surprise that theft offences have risen by 6.3% across the UK. But which areas is theft most prominent? We’ve revealed the areas of the UK with the most theft cases per 1,000 people.
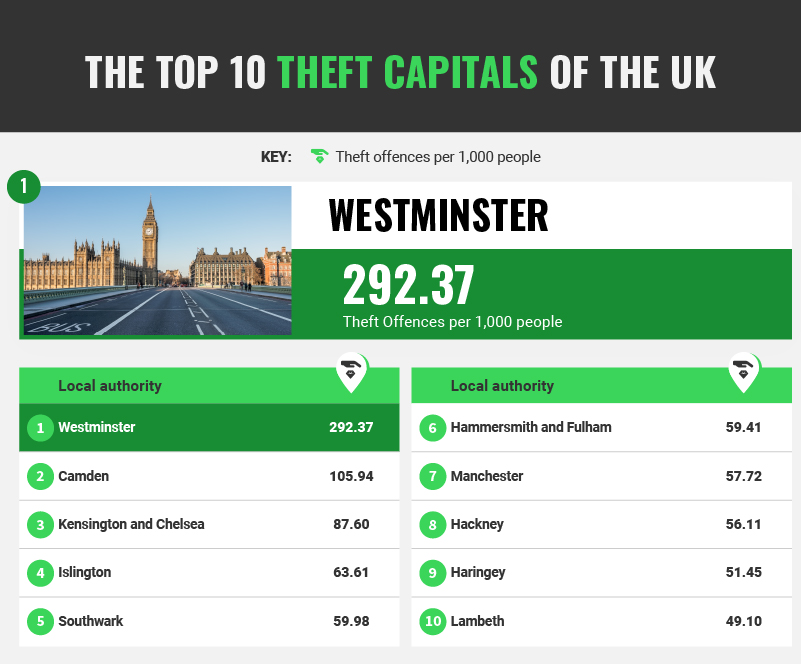
- Westminster – 292.37 cases of theft per 1,000 people
Taking the top spot is Westminster, with just under 300 cases of theft per 1,000 people. Westminster’s prevalence of theft is almost three times higher than second place on our list. Theft was committed almost 60,000 times in Westminster, which is also the highest total in the UK. Unsurprisingly, theft was also the most prevalent crime in Westminster, making up almost 70% of all crimes committed in this London borough.
- Camden – 105.94 cases of theft per 1,000 people
Camden takes second place, with 105.94 cases of theft per 1,000 people. Theft offences were committed more than 22,000 times between June 2022 and June 2023, the fifth-highest total for a local authority. Theft was also the most prevalent crime in Camden, accounting for almost 60% of all crimes committed in this London borough.
- Kensington and Chelsea – 87.6 cases of theft per 1,000 people
Completing an all-London top three is Kensington and Chelsea, with 87.6 cases of theft per 1,000 people. Nine London boroughs made the top 10, with Manchester being the only local authority outside the capital. More than half of all crimes committed in this London borough were theft offences, occurring more than 12,000 times.
The drug capital of the UK is Westminster, with 15.73 drug offences per 1,000 people
From June 2022 to June 2023, the number of drug offences increased by an average of 8% across the UK. But which areas of the UK are home to the most drug offences? We’ve revealed the areas of the UK with the most drug offences per 1,000 people.
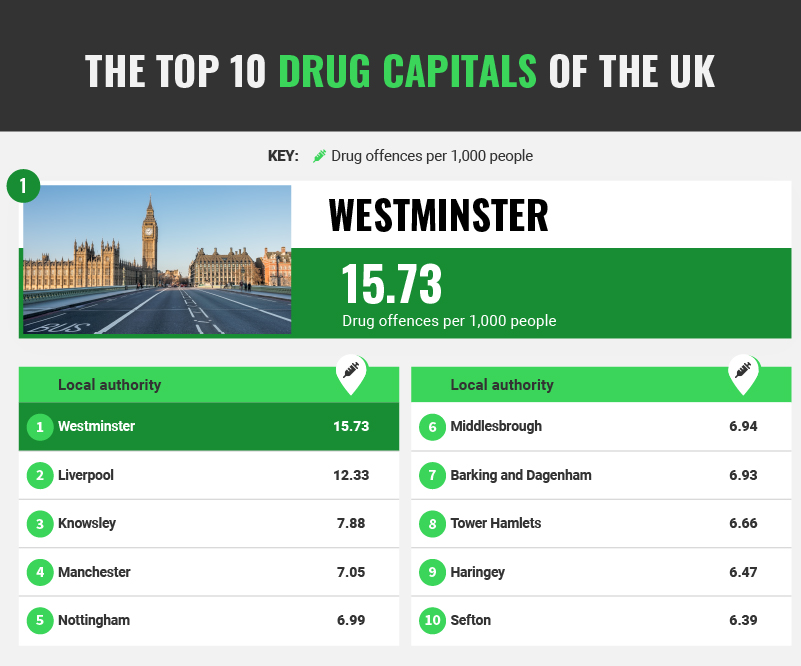
- Westminster – 15.73 drug offences per 1,000 people
Taking the top spot is Westminster, with 15.73 drug offences per 1,000 people. Westminster’s total number of drug offences was the fourth highest in the UK, with 3,226 cases between June 2022 and June 2023. Despite the high number of drug crimes in Westminster, there were just 1.5 deaths relating to drug misuse per 1,000 people.
- Liverpool – 12.33 drug offences per 1,000 people
In second place is Liverpool, with 12.33 drug offences per 1,000 people. There were almost 6,000 cases of drug offences in Liverpool between June 2022 and June 2023, the highest total in the UK. According to Merseyside police, there were 120 gangs in 2023 operating in Liverpool, with many involved in the drug trade.
- Knowsley – 7.88 drug offences per 1,000 people
Our top three is completed by Knowsley, with 7.88 drug offences per 1,000 people. Between June 2022 and June 2023, there were 1,221 drug offences in total, the sixth most commonly committed crime in this north-west council. Despite its high prevalence of drug offences, just 1.1 people per 1,000 died from drug misuse.
Manchester has more public order offences than any other area of the UK, with 24 per 1,000 people
A public order offence is an act of violence or intimidation in public. It is often a crime which interferes with the normal function of society. It can include riots, threats or provocation of violence, and drunk and disorderly behaviour.
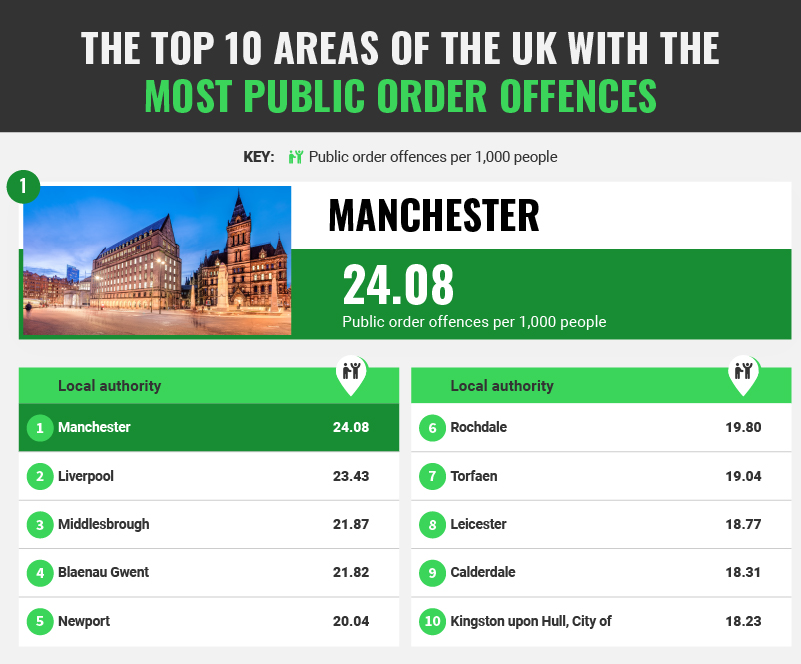
- Manchester – 24.08 public order offences per 1,000 people
Manchester takes the top spot, with 24 public order offences per 1,000 people. There were 13,243 reports of public order offences in just 12 months, the third-highest total in the UK. Despite being top on this list, public order offences in Manchester have decreased by 2%.
- Liverpool – 23.43 public order offences per 1,000 people
In second place is Liverpool, with 23.43 public order offences per 1,000 people. In total, public order offences were committed 11,352 times in Liverpool, which is the fourth-highest in the UK. Between June 2022 and June 2023, public order offences increased by 2%.
- Middlesbrough – 21.87 public order offences per 1,000 people
Middlesbrough completes our top three, with almost 22 public order offences per 1,000 people. Middlesbrough has seen a 5% increase in public order offences between June 2022 and June 2023, the highest increase in our top three. In total, people in Middlesbrough committed 3,143 public order offences.
Blackpool is the most antisocial area of the UK, with 66 antisocial behaviour offences per 1,000 people
Antisocial behaviour is described as behaviour that causes or could cause distress to persons not in the same household as the person. Some examples include verbal abuse and bullying, and it is split into three categories: personal, environmental, and nuisances.
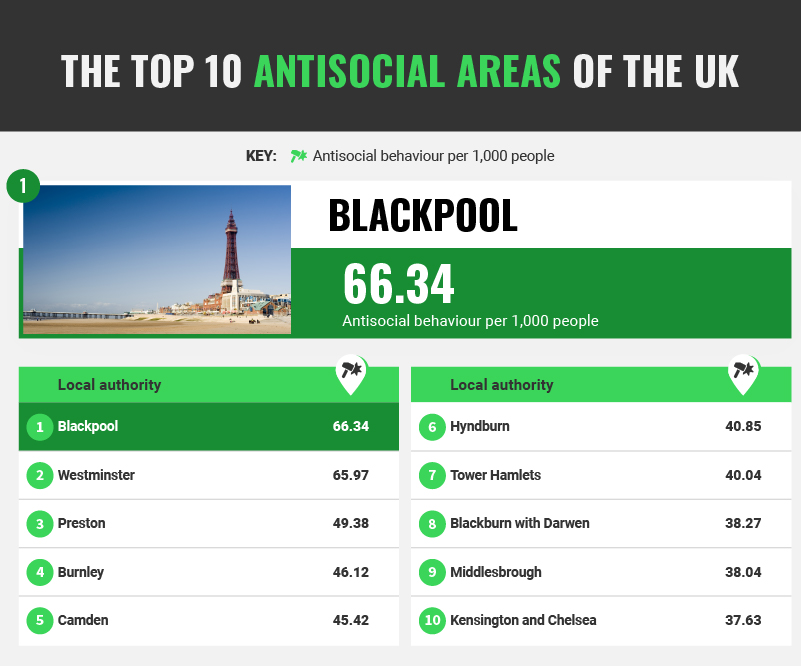
- Blackpool – 66.34 antisocial behaviour offences per 1,000 people
Taking the crown as the most antisocial area of the UK is Blackpool, with just over 66 antisocial behaviour offences per 1,000 people. In total, 9,351 antisocial behaviour incidents were recorded in 12 months. Nuisance was the category of antisocial behaviour with the most recorded incidents, followed by personal and environmental.
- Westminster – 65.97 antisocial behaviour offences per 1,000 people
In second place is Westminster, with just under 66 antisocial behaviour offences per 1,000 people. Westminster’s total antisocial behaviour offences is the highest in the UK, at just over 13,500 recorded offences. Almost 90% of these were categorised as nuisances, with personal cases making up around 8% of antisocial behaviour offences.
- Preston – 49.38 antisocial behaviour offences per 1,000 people
Preston completes our top three, with just under 50 antisocial behaviour offences per 1,000 people. There were 7,290 reports of antisocial behaviour, with 5,201 of these categorised as nuisance offences. Despite its third-place ranking on our list, antisocial behaviour in Preston has decreased by 17%.
Crime in Lichfield has increased more than any other area of the UK, increasing by 34%
The level of crime can change for several reasons. An increase in crime could be down to a person’s confidence in reporting a crime, authorities cracking down on a particular crime, or even introducing a new technology. We’ve revealed the areas of the UK with the biggest percentage increase in crime between June 2022 and June 2023.

- Lichfield – 34% increase in crime
Taking the top spot is Lichfield, where an increase of 34% in crime has been recorded. In Lichfield, the only category of crime that did not record an increase between June 2022 and June 2023 was violence without injury, which decreased by 9%. All other crimes recorded an increase of at least 12%. The category of crime that recorded the largest increase was miscellaneous crimes against society, which increased by 71%.
- Westminster – 30% increase in crime
Westminster is featured once again on our list, with a 30% increase in crime, enough to take second place on this list. Despite recording the second biggest increase in crime between June 2022 and June 2023, crime decreased in more than a third of categories. The largest increase in crime recorded in Westminster was all other theft offences.
- Cannock Chase – 25% increase in crime
Completing our top three is Cannock Chase, with a 25% increase in crime between June 2022 and June 2023. The category of crime with the biggest increase was miscellaneous crimes against society, increasing by 165%. This was also one of the largest increases across all categories and all local authorities.
Methodology
We sourced our data for the following factors from the Office of National Statistics:
- Total recorded crime
- Violence against the person
- Stalking and harassment
- Theft offences
- Drug offences
- Public order offences
- Antisocial behaviour
- Total recorded crime percentage increase
All data, excluding antisocial behaviour, was sourced using data tables for the year ending June 2023. Data reflects figures between June 2022 and June 2023.
Antisocial behaviour was sourced from the data tables for the year ending March 2023.
All figures, excluding the total recorded crime percentage increase, have been normalised against the population to show figures per 1,000.
We put all factors into a weighted table, giving each factor a normalised score out of 10. We then took an average of these scores to get an overall crime score out of 10.
The UK’s number 1 course finder
Best price guarantee
We offer price match if you find the same course cheaper elsewhere
100% money back guarantee
Get a full refund if you don’t like the course. Terms apply.
5-star customer support
Consistently rated 5-stars on review sites like Trustpilot
£0 booking fee
We never charge any booking or hidden fees
Instant eLearning access
Get FREE access to eLearning course materials instantly after you book
Top-rated training providers
Over 90% of our customers pass the exam in the first attempt

