
 Trustpilot


POPULAR COURSES

ALL COURSES
- L2 Award for Cash And Valuables In Transit (CViT)
- Security Drone Pilot
- Security Screening BS7858
- SIA CCTV Operator Training
- SIA Close Protection Training
- SIA Door Supervisor Training
- SIA Security Guard Training
- SIA Top-Up Refresher Training for Close Protection
- SIA Top-Up Refresher Training for Door Supervisor
- SIA Top-Up Refresher Training for Security Guard
- Use of Mechanical Restraints (Handcuffs) - L3 Award
POPULAR LICENCES
ALL LICENCES
- Cash and Valuables in Transit (CVIT) Licence
- CCTV Licence
- Close Protection Licence
- How to get an SIA Licence
- Key Holding Licence
- Security Guard Licence
- SIA Door Supervisor Licence
- SIA Licence Bangladesh Passport
- SIA Licence Ghanaian Passport
- SIA Licence Indian Passport
- SIA Licence Irish Passport
- SIA Licence Nigerian Passport
- SIA Licence on Pakistani Passport
- SIA Licence Poland Passport
- SIA Licence Romanian Passport
- SIA Licence South African Passport
POPULAR COURSES
ALL LOCATIONS
- Andover
- Ashford
- Aylesbury
- Barnsley
- Basingstoke
- Belfast
- Birmingham
- Birmingham-Central
- Birmingham-Central Tyseley
- Birmingham-Edgbaston
- Blackburn
- Bournemouth
- Bradford
- Brentwood
- Brighton
- Bristol
- Burnley
- Bushey
- Cambridge
- Cardiff
- Carlisle
- Chatham
- Chelmsford
- Cheltenham
- Chester
- Colchester
- Coventry
- Crawley
- Crawley-Central
- Derby
- Dundee
- Durham
- Edinburgh
- Exeter
- Exeter-South West
- Exmouth
- Glasgow
- Gloucester
- Hemel Hempstead
- Hereford North
- Hull
- Ipswich
- Leeds
- Leicester
- Leicester-City Centre
- Liverpool
- London-Acton
- London-Aldgate
- London-Barnet
- London-Beckenham
- London-Bermondsey
- London-Bromley
- London-Central
- London-Chigwell
- London-Clapham
- London-Croydon
- London-Ealing
- London-East Ham
- London-Enfield
- London-ExCeL
- London-Finsbury Park
- London-Greenford
- London-Hanwell
- London-Hayes-and-Southall
- London-Holborn
- London-Ilford
- London-Kennington
- London-Kingston Upon Thames
- London-Mile-End
- London-Park Royal
- London-Putney
- London-Ruislip
- London-Russell Square
- London-South Croydon
- London-Tottenham Court Rd
- London-Uxbridge
- London-Wembley
- London-Westminster
- London-Wimbledon
- London-Wood Green
- London-Woolwich
- Luton
- Manchester
- Manchester-Central
- Manchester-Piccadilly
- Middlesbrough
- Milton Keynes
- Milton Keynes-Central
- Newcastle Upon Tyne
- Newcastle upon Tyne- Central
- Newport
- Northampton
- Norwich
- Nottingham
- Nottingham-City Centre
- Nottingham-Derby
- oban
- Omagh
- Peterborough
- Plymouth
- Portsmouth
- Preston
- Reading
- Salisbury
- Sheffield
- Slough
- Southampton
- Stoke-on-Trent
- Swansea
- Swindon
- Telford
- Wakefield
- Watford
- Wiltshire
- Winchester
- Wolverhampton
- Worcester
- Andover
- Barnsley
- Belfast
- Birmingham
- Bolton-Breightmet Street
- Bournemouth
- Bradford
- Brentwood
- Brighton
- Bristol
- Cardiff
- Chelmsford
- Chester
- Coventry
- Derby
- Edinburgh
- Glasgow
- Hereford North
- Leeds
- Leicester
- Liverpool
- London-Central
- London-Chigwell
- London-Croydon
- London-Finsbury Park
- London-Greenford
- London-Holborn
- London-Holborn-Central
- London-Ilford
- London-Kensington
- London-Ruislip
- London-Russell Square
- London-Tottenham Court Rd
- London-Wembley
- London-Westminster
- London-Wood Green
- London-Woolwich
- Luton
- Manchester
- Manchester-Central
- Milton Keynes
- Milton Keynes-Central
- Newcastle Upon Tyne
- Newport
- Northampton
- Norwich
- Nottingham
- Plymouth
- Portsmouth
- Preston
- Salisbury
- Sheffield
- Slough
- Southampton
- Stoke-on-Trent
- Swansea
- Swindon
- Telford
- Wakefield
- Winchester
- Worcester
- Zoom
- Birmingham
- Birmingham-Central Tyseley
- Birmingham-Edgbaston
- Bradford
- Bristol
- Cardiff
- Chester
- Coventry
- Hull
- Leeds
- Leicester
- Liverpool
- London-Aldgate
- London-Central
- London-East Ham
- London-ExCeL
- London-Holborn
- London-Kingston Upon Thames
- London-Mile-End
- London-Russell Square
- London-Tottenham Court Rd
- London-Westminster
- Manchester
- Newcastle Upon Tyne
- Newport
- Nottingham-City Centre
- oban
- Portsmouth
- Reading
- Reading-City Centre
- Sheffield-City Centre
- Slough
- Stoke-on-Trent
- Andover
- Ashford
- Aylesbury
- Barnsley
- Basingstoke
- Belfast
- Birmingham
- Birmingham-Central
- Birmingham-Central Tyseley
- Bolton
- Bolton-Breightmet Street
- Bournemouth
- Bradford
- Brentwood
- Brighton
- Bristol
- Bushey
- Cambridge
- Cardiff
- Chatham
- Chelmsford
- Cheltenham
- Chester
- Colchester
- Coventry
- Crawley
- Derby
- Edinburgh
- Exeter
- Exmouth
- Glasgow
- Gloucester
- Guildford
- Hemel Hempstead
- Hereford North
- Hull
- Ipswich
- Leeds
- Leeds Central
- Leicester-City Centre
- Liverpool
- London-Acton
- London-Aldgate
- London-Barnet
- London-Beckenham
- London-Bermondsey
- London-Bromley
- London-Central
- London-Chigwell
- London-Clapham
- London-Croydon
- London-Dagenham
- London-East Ham
- London-Enfield
- London-ExCeL
- London-Finsbury Park
- London-Greenford
- London-Hayes-and-Southall
- London-Holborn
- London-Holborn-Central
- London-Ilford
- London-Kennington
- London-Kensington
- London-Kingston Upon Thames
- London-Mile-End
- London-Park Royal
- London-Putney
- London-Romford
- London-Ruislip
- London-Russell Square
- London-Stratford
- London-Tottenham Court Rd
- London-Uxbridge
- London-Wembley
- London-Wimbledon
- London-Wood Green
- London-Woolwich
- Luton
- Manchester
- Manchester-Central
- Manchester-Piccadilly
- Middlesbrough
- Milton Keynes
- Milton Keynes-Central
- Newcastle Upon Tyne
- Newcastle upon Tyne- Central
- Newport
- Northampton
- Norwich
- Nottingham
- oban
- Oldham
- Peterborough
- Plymouth
- Portsmouth
- Preston
- Reading
- Salisbury
- Sheffield
- Slough
- Southampton
- Southend On Sea
- Stoke-on-Trent
- Swindon
- Telford
- Wakefield
- Watford
- Wiltshire
- Winchester
- Woking
- Wolverhampton
- Worcester
- Andover
- Birmingham
- Bolton-Breightmet Street
- Bournemouth
- Bristol
- Cardiff
- Chester
- Coventry
- Derby
- Glasgow
- Hereford North
- Leeds
- Leicester
- Liverpool
- London-Aldgate
- London-Brixton
- London-Central
- London-East Ham
- London-ExCeL
- London-Finsbury Park
- London-Holborn
- London-Kensington
- London-Mile-End
- London-Russell Square
- London-Tottenham Court Rd
- London-Wood Green
- Manchester
- Newcastle Upon Tyne
- Newport
- Nottingham
- oban
- Portsmouth
- Salisbury
- Sheffield
- Slough
- Southampton
- Telford
- Winchester
- Worcester
ALL CAREERS
- ARC Operator
- Area Relief Security Officer
- Close Protection Officer
- Control Room Operator
- Corporate Security Officer
- Distribution Security Officer
- Front of House Officer
- Key Response Officer
- Loading Bay Supervisor
- Mobile Security Supervisor
- Night Shift Security Officer
- Nightclub Doorman
- Retail Security Officer
- Security Command Centre Manager
- Security Concierge
- Security Manager
- Security Patrol Officer
- Static Security Officer
- Venue Security Officer
UK Firearm Statistics: Top Regions, Offences, Licences, and Trends Revealed
by Get Licensed | March 05, 2024 | Reading Time: 14 mins
The United Kingdom is home to some of the world’s strictest firearm control laws, yet firearms remain a critical topic when discussing security and public safety. Between 2022 and 2023 alone, nearly 6,000 firearm-related crimes were reported.
But where in the UK are firearms most common? Which areas report the highest number of firearm offences in the UK? And how does legal ownership compare to illegal use? We've crunched the numbers from various government sources to reveal key insights into firearm offences, legal ownership trends, and licensing statistics. From the areas with the most registered shotguns to the regions spending the most on firearm certificates, this report uncovers the UK's firearm hotspots in detail.
Whether you're a security professional in training or just curious about the state of firearms in the UK, our data-driven analysis paints a clear picture of this complex and critical issue.
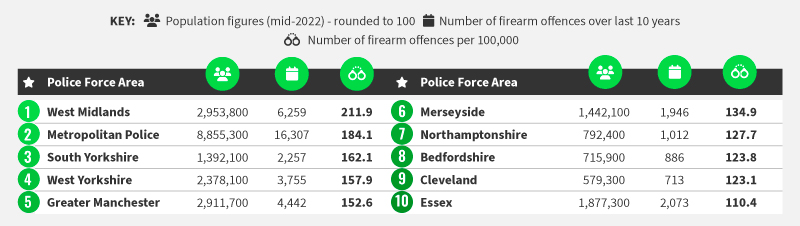
Top 10 Police Forces With The Most Firearm Offences Per 100,000
The West Midlands police force has recorded more firearm offences than any other area of the UK, with more than 200 per 100,000 people
Illegal purchasing, illegal distribution, and carrying in a public place are among the many crimes covered under firearm offences. We’ve revealed the areas of the UK with the most firearm offences per 100,000 of its population.
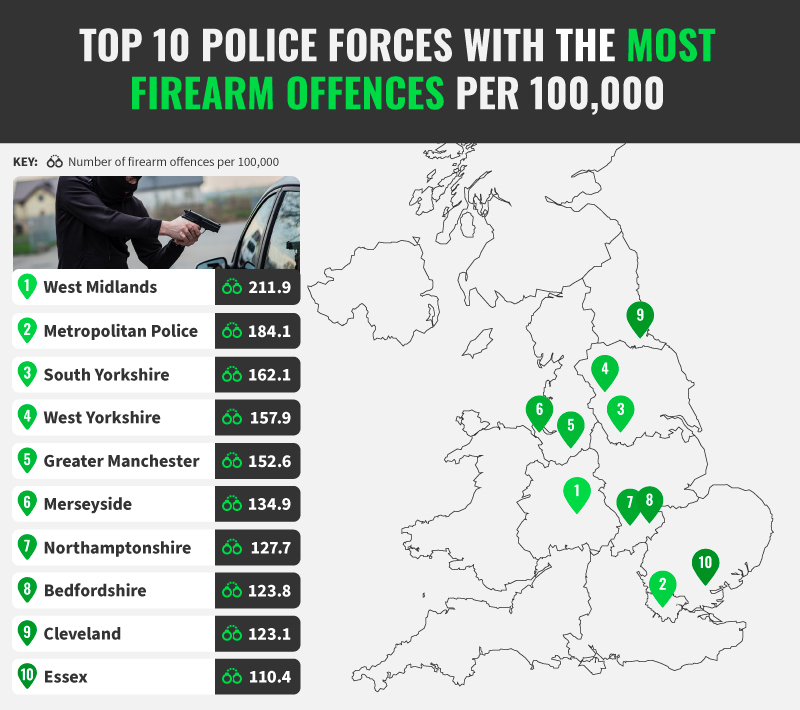
1. West Midlands – 211.9 firearm offences per 100,000
West Midlands takes the top spot with 211.9 firearm offences per 100,000 people. In total, over 6,000 firearm offences were committed over the last 10 years, the second highest in the UK. On average, 626 firearm offences are committed each year in the West Midlands.
2. Metropolitan Police – 184.1 firearm offences per 100,000
In second place is the Metropolitan Police, recording 184.1 firearm offences per 100,000 people. The Metropolitan Police covers London’s local authorities, with Westminster being the local authority with the most possession of weapons offences, followed by Croydon and Lambeth.
3. South Yorkshire – 162.1 firearm offences per 100,000
Our top three is completed by South Yorkshire, with 161.2 firearm offences per 100,000 people. Across the whole of South Yorkshire, possession of firearm offences has increased by 15%. However, it was Rotherham that was responsible for the largest increase, at 39%.
To fully understand how firearm offences fit within the broader crime landscape, including theft, assaults, and drug-related offences, check out our UK Crime Report 2024. It provides a comprehensive analysis of crime trends across the country and helps contextualise these firearm-specific statistics.
Top 10 Police Force Areas With The Most Firearm/Shotgun Certificate Holders
More people in Dyfed-Powys have firearm/shotgun certificates than any other area of the UK, with almost 2,500 per 100,000 people
To buy or acquire a firearm or shotgun, you need to have an application approved by your local police force. We’ve revealed the police force areas with the most firearm and/or shotgun certificate holders per 100,000.
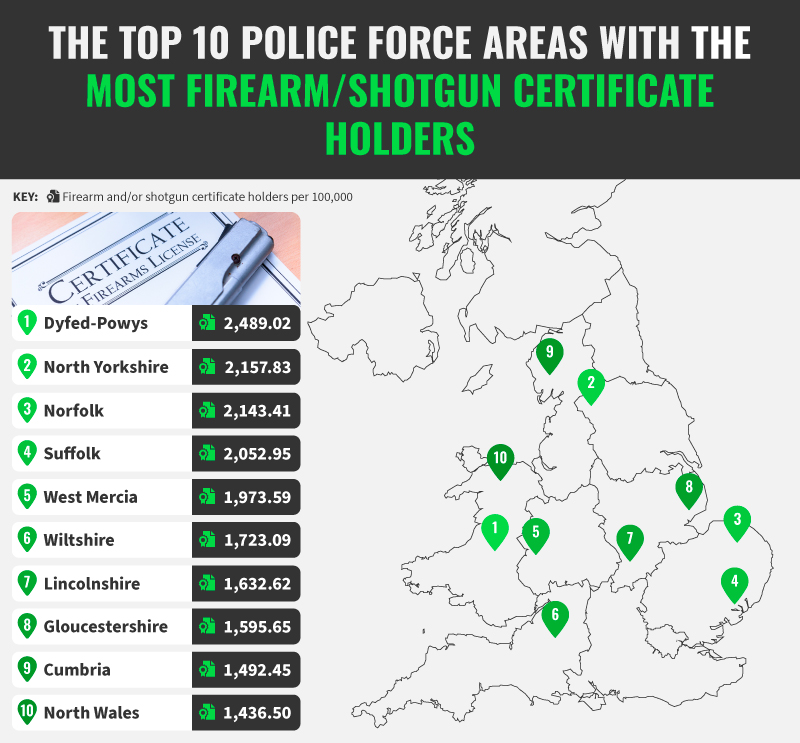
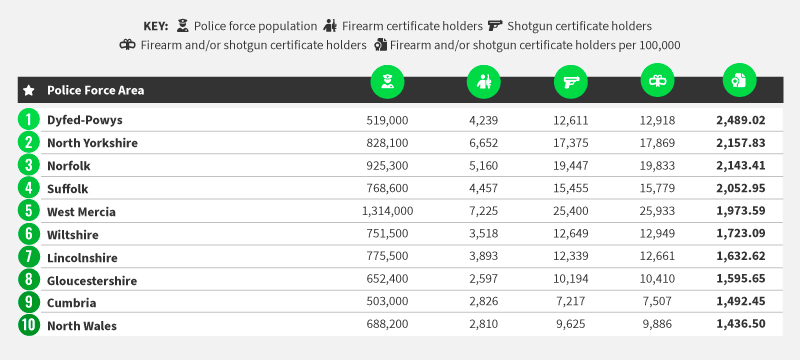
1. Dyfed-Powys – 2,489.02 firearm/shotgun certificate holders per 100,000
Dyfed-Powys takes first place with almost 2,500 firearm/shotgun certificate holders per 100,000. In total, there are almost 13,000 certificate holders in Dyfed-Powys, which is the 15th highest in the UK. There are almost 34,000 shotguns covered by certificates in Dyfed-Powys, with the average number of shotguns per certificate being 2.7.
2. North Yorkshire – 2,157.83 firearm/shotgun certificate holders per 100,000
In second place is North Yorkshire, with more than 2,100 people owning a firearm and/or shotgun certificate per 100,000. The average number of shotguns per certificate in North Yorkshire is 2.7, with 17,375 shotgun certificates covering 47,193 shotguns.
3. Norfolk – 2,143.41 firearm/shotgun certificate holders per 100,000
Norfolk completes our top three, with 2,143 people owning firearms and/or shotgun licences per 100,000 people. There are almost 60,000 shotguns covered by licences in Norfolk, with almost 20,000 people owning a shotgun certificate.
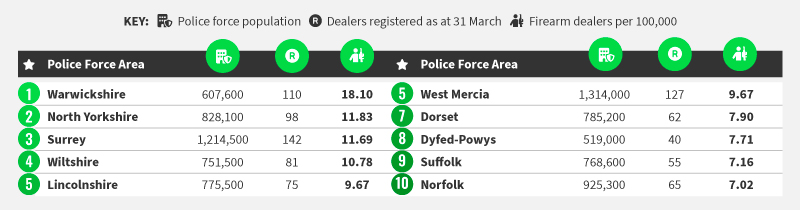
Top 10 Police Force Areas With The Most Registered Firearms Dealers
Warwickshire has the greatest number of firearms dealers in the UK, with 18.1 for every 100,000 people
Firearms dealers are those with the licence to sell, transfer, repair, and test firearms and ammunition. To become a firearms dealer, you must apply with your local police force and provide information on all areas where your business will be carried out.
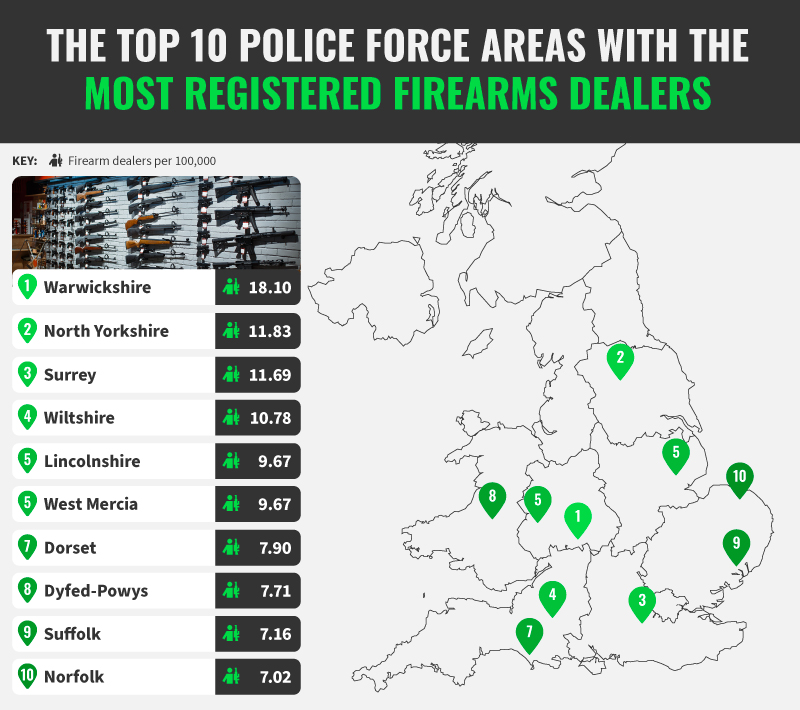
1. Warwickshire – 18.10 firearm dealers per 100,000 people
Warwickshire has more firearm dealers than any other area of the UK, with 18.1 per 100,000 people. Warwickshire’s total of 110 registered dealers is the ninth-highest in the UK. However, you could argue that it’s an oversaturated industry, with Warwickshire being in the bottom half of UK areas for the number of people with a firearm and/or shotgun certificate.
2. North Yorkshire – 11.83 firearm dealers per 100,000 people
In second place is North Yorkshire, with 11.83 firearm dealers per 100,000 people. There are just under 100 registered dealers in North Yorkshire, which is the 12th highest in the UK. This area’s high number of firearm dealers is clearly beneficial, as North Yorkshire’s number of firearm possession offences is one of the lowest in the UK, showing this area is acquiring their firearms legally.
3. Surrey – 11.69 firearm dealers per 100,000 people
Our top three is completed by Surrey, with 11.69 registered firearms dealers per 100,000 people. Behind Metropolitan Police and Thames Valley, Surrey’s total number of firearm dealers is the third-highest in the UK at 142. However, the number of people who own a shotgun and/or firearm certificate is only the 18th highest in the UK.
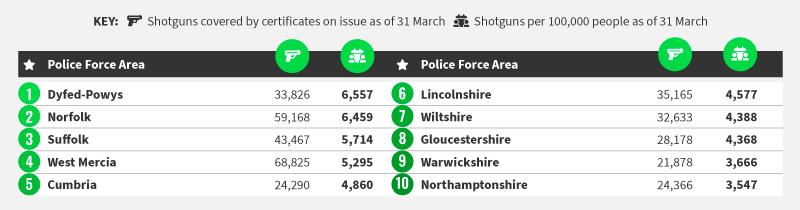
Top 10 Police Force Areas With The Most Shotguns
Dyfed-Powys has more guns than any area of the UK, with more than 6,500 shotguns per 100,000 people
We’ve looked at the number of shotguns covered by licences in each police force area to reveal the areas of the UK with the most guns.
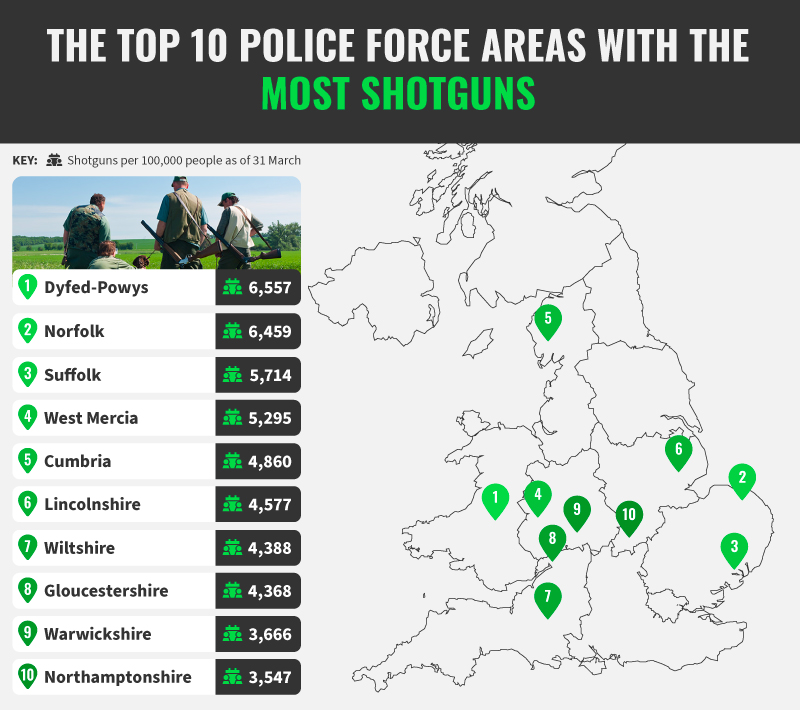
1. Dyfed-Powys – 6,557 shotguns per 100,000 people
Taking the top spot is Dyfed-Powys with 6,557 shotguns per 100,000 people. This Welsh county’s total of 33,826 shotguns is only the 15th highest in the UK. Despite the high number of shotguns in this area, the number of firearm offences per 100,000 is among the lowest in the UK. The total number of possession of weapon offences in Dyfed-Powys is also the lowest in the UK.
2. Norfolk – 6,459 shotguns per 100,000 people
In second place is Norfolk with almost 6,500 shotguns per 100,000 people. This county in the East of England has the fourth-highest number of shotguns in total, with almost 60,000. Despite this, both Norfolk’s firearm offences and possession of firearm offences are amongst the UK’s lowest.
3. Suffolk – 5,714 shotguns per 100,000 people
Our top three is completed by Suffolk, with 5,714 shotguns per 100,000 people. The theme throughout our top three is that more legally registered shotguns means fewer firearm-related offences. Suffolk continues this trend, sitting in the bottom 10 police force areas of the UK for firearm and possession of firearm offences.
Top 10 Police Force Areas With The Most Refused Firearm Licence Applications
Applications for firearms in Durham have been refused more than any other police force area, with over 17% of applications being rejected.
To apply for a firearm or shotgun licence, you need to fill out the application form, provide a passport photograph, and pay the fee. You also need two referees for a firearm certificate and one referee for a shotgun certificate. Furthermore, you must be able to prove to the chief officer of the police that you pose no threat to the public.
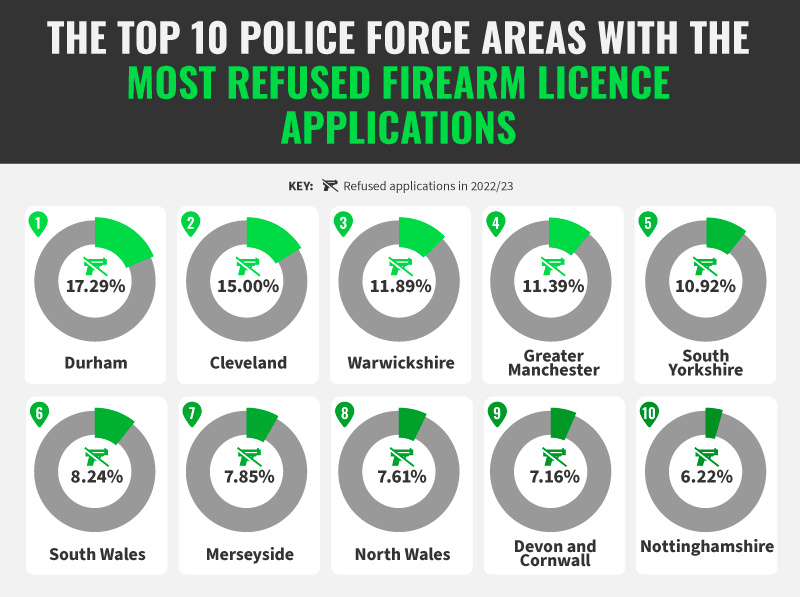
1. Durham – 17.29% refused applications in 2022/23
The police force area with the most refused licences was Durham, with 17.29% of applications being refused. People in Durham submitted 129 applications for shotguns and 91 applications for firearms, with 35 and 11 refusals, respectively.
2. Cleveland – 15% refused applications in 2022/23
Cleveland takes second place with a firearms/shotgun refusal rate of 15%. People in Cleveland sent 35 applications for firearms and 82 applications for shotguns, with 5 and 16 refused applications, respectively.
3. Warwickshire – 11.89% refused applications in 2022/23
Our top three are completed by Warwickshire, with 12% of applications being refused between April 2022 and March 2023. Residents in Warwickshire sent 353 applications for shotguns and 151 applications for firearms, with 50 refusals for shotguns and 18 refusals for firearms. Warwickshire’s total number of refusals was the highest in the UK at 68 rejected applications.
Top 10 Police Force Areas With The Most Shotgun And Firearm Certificate Revocations
More shotgun and firearm licences have been revoked in Devon and Cornwall than any other area, with 110 revocations
A firearm or shotgun certificate lasts for five years from the date it was issued or renewed. Once it expires, you must renew your licence. However, the police will review your application and have the right to refuse your renewal on a number of grounds. This could be due to behaviours, mental health, and reasonings for needing or wanting a firearm.
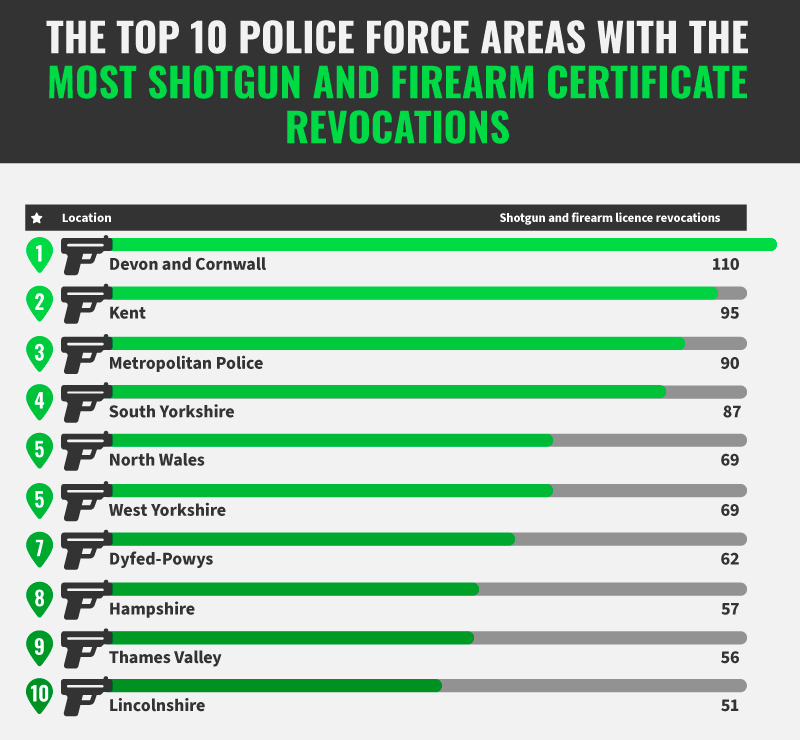
1. Devon and Cornwall – 110 shotgun and firearm licence revocations
Devon and Cornwall take the top spot, with 110 revocations of shotgun and firearm licences. This was split between 73 revoked shotgun licences and 37 firearm licence revocations, both of which were the highest in the UK for their respective licences.
2. Kent – 95 shotgun and firearm licence revocations
In second place is Kent, with 95 shotgun and firearm licences getting revoked between April 2022 and March 2023. Kent had 66 revocations of shotgun licences, which was the fifth-highest in the UK, despite their second-place ranking in our list. However, their 29 revocations of firearm certificates were the second highest in the UK.
3. Metropolitan Police – 90 shotgun and firearm licence revocations
Metropolitan Police completes our top three, with 90 shotgun and firearm licence revocations. There were 20 revocations of firearm certificates, the fourth-highest in the UK, and 70 revocations of shotgun certificates, the second-highest in the UK.
Top 10 Police Force Areas With The Most Spent On Renewing And Applying For Their Firearm And Shotgun Certificates
People in Kent have spent more than £310k on their firearm and shotgun certificates, more than any other area of the UK
To apply for a new shotgun licence, you must pay a fee of £79.50, and to renew it, you must pay £49. For firearms, a new certificate will cost £88, with a £62 fee to renew it. We’ve combined the number of applications and renewals with the cost of licences to reveal the areas that have spent the most money on their gun certificates.
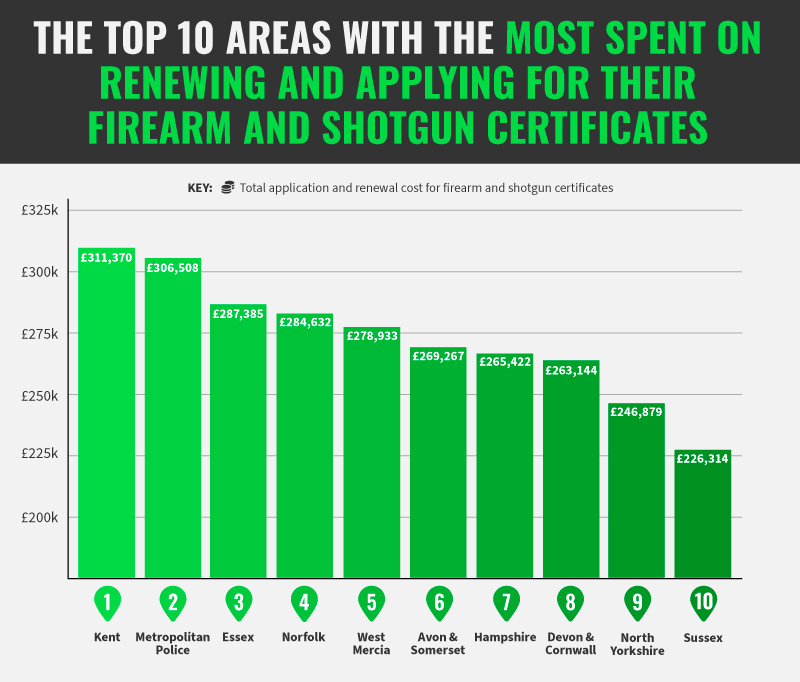
1. Kent – £311,370 spent on shotgun and firearm applications and renewals
With an expenditure of £311,370 between April 2022 and March 2023, Kent takes the top spot. Kent residents have paid more than £200,000 for shotgun applications and renewals and almost £100,000 for firearms applications and renewals. However, neither amount is the highest in the UK, with shotgun and firearm applications and renewals ranking second and fourth highest in the UK.
2. Metropolitan Police – £306,508 spent on shotgun and firearm applications and renewals
People in the Metropolitan Police Force area have spent more than £240,000 on shotgun grants and renewals and £65,000 on firearm grants and renewals. Whilst the total shotgun expenditure is the highest in the UK, the expenditure on firearm certificates ranks outside of the top 10 for this category. Nonetheless, people within the Metropolitan Police Force area have spent more than £300,000 on gun certificates, enough for the area to take second place.
3. Essex – £287,385 spent on shotgun and firearm applications and renewals
Essex completes our top three, with an expenditure on shotgun and firearm applications and renewals of almost £290,000. People in Essex spent almost £80,000 on firearm applications and renewals and over £200,000 on shotgun applications and renewals, the eighth and third-highest in the UK, respectively.
Most Common Firearms Used in UK Crimes: Weapons Offence Trends Over the Last Decade
BB guns/soft air weapons were reported as the principal weapon almost 13,000 times in the last 10 years, more than any other weapon
We’ve revealed which firearms were used most commonly in criminal activity. To do this, we’ve combined the number of offences for each firearm over the last 10 years.
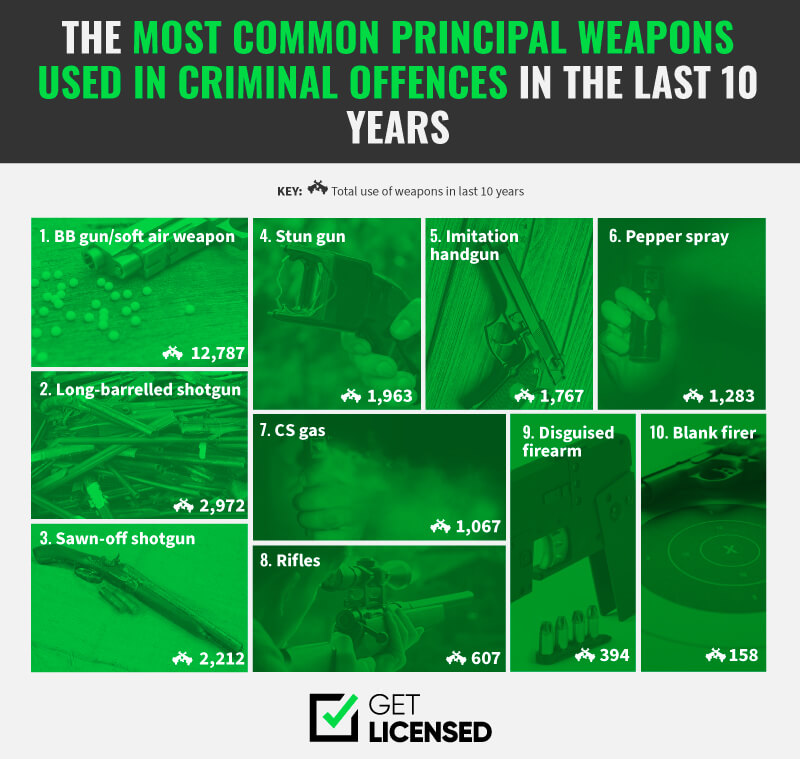
1. BB gun/soft air weapon – 12,787 offences in the last 10 years
BB guns/soft air weapons take the top spot, with 12,787 offences recorded by the police in the last 10 years. The number of offences involving a BB gun/soft air weapon has almost doubled in the last year, going from 951 in March 2014 to 1,850 in March 2023. March 2023’s total was also the highest number of offences recorded. The high number of offences involving BB guns/soft air weapons may largely be down to the fact you do not need a licence to purchase these weapons.
2. Long-barrelled shotgun – 2,972 offences in the last 10 years
The second most common weapon used in firearm offences was the long-barrelled shotgun, with almost 3,000 in the last 10 years. The use of long-barrelled shotguns in firearm offences has decreased since 2014, from 227 to 224 in 2023. The use of long-barrelled shotguns peaked in 2018, with 384 offences recorded by the police.
3. Sawn-off shotgun – 2,212 offences in the last 10 years
Completing our top three is the sawn-off shotguns, with more than 2,000 offences in the last 10 years. The number of offences reported where a sawn-off shotgun was used peaked in 2019, with 325 offences recorded. Since then, it has decreased yearly, with 202 reports in March 2023.
Firearms are not the only weapons of concern in the UK. Knife crime remains a major issue, with certain regions experiencing sharp increases in offences. To learn more about knife-related offences and which areas are most affected, explore our England’s Knife Crime Hotspots in 2024. This report highlights knife crime trends and provides crucial insights into public safety across England.
The Role of SIA Security Officers in Tackling Firearm Risks and Protecting Communities
Firearm offences in the UK might not be as widespread as in other countries, but they’re still a serious concern – especially for those working in security. That’s where SIA-licensed security officers step in. Their training equips them with the tools to identify potential risks, defuse tense situations, and work alongside the police to help keep communities safe.
Understanding trends in firearm offences, like those explored in this report, allows SIA security officers to better prepare for challenges specific to their area. Whether it’s overseeing a busy venue in a high-risk region or staying vigilant for suspicious activity, they play a key role in preventing incidents and ensuring public safety.
Training is a crucial part of this preparation. Security training courses like those offered by Get Licensed are designed to equip aspiring security officers with the practical skills and knowledge needed to handle risks, respond to emergencies, and step into the industry with confidence.
SIA security officers aren’t just there to react when things go wrong – they’re an essential part of the solution, actively creating safer environments and giving communities peace of mind every day.
Firearm Statistics in the UK: Methodology and Data Sources Explained
We used ONS for the number of firearm offences per police force area. We took the total number of offences over the last 10 years (April 2013 – March 2014 to April 2022 – March 2023)
We used the same dataset to find the most common firearms to be used in offences. We then used gov.uk to find the number of firearm certificate holders per 100,000 in March 2023 per police force area.
We used the same dataset to find the percentage of refused applications per police force area, the number of shotguns per 100,000 people per police force area, the number of dealers per 100,000 per police force area, and the number of revocations per 100,000 people.
We then used Met Police's firearms licensing fees to calculate the expenditure on applications and renewals per police force area.
Launch your career as a
Security Guard in the UK
Learn how to start your career in UK security industry.
Explore Courses


Find work, try mock tests and book courses from
the UK’s #1 app for security professionals


Get Licensed helps you get SIA trained, licensed, and ready for real security jobs — trusted by 450,000+ people across the UK.


