
 Trustpilot


POPULAR COURSES

ALL COURSES
- L2 Award for Cash And Valuables In Transit (CViT)
- Security Drone Pilot
- Security Screening BS7858
- SIA CCTV Operator Training
- SIA Close Protection Training
- SIA Door Supervisor Training
- SIA Security Guard Training
- SIA Top-Up Refresher Training for Close Protection
- SIA Top-Up Refresher Training for Door Supervisor
- SIA Top-Up Refresher Training for Security Guard
- Use of Mechanical Restraints (Handcuffs) - L3 Award
POPULAR LICENCES
ALL LICENCES
- Cash and Valuables in Transit (CVIT) Licence
- CCTV Licence
- Close Protection Licence
- How to get an SIA Licence
- Key Holding Licence
- Security Guard Licence
- SIA Door Supervisor Licence
- SIA Licence Bangladesh Passport
- SIA Licence Ghanaian Passport
- SIA Licence Indian Passport
- SIA Licence Irish Passport
- SIA Licence Nigerian Passport
- SIA Licence on Pakistani Passport
- SIA Licence Poland Passport
- SIA Licence Romanian Passport
- SIA Licence South African Passport
POPULAR COURSES
ALL LOCATIONS
- Andover
- Ashford
- Aylesbury
- Barnsley
- Basingstoke
- Belfast
- Birmingham
- Birmingham-Central
- Birmingham-Central Tyseley
- Birmingham-Edgbaston
- Blackburn
- Bournemouth
- Bradford
- Brentwood
- Brighton
- Bristol
- Burnley
- Bushey
- Cambridge
- Cardiff
- Carlisle
- Chatham
- Chelmsford
- Cheltenham
- Chester
- Colchester
- Coventry
- Crawley
- Crawley-Central
- Derby
- Dundee
- Durham
- Edinburgh
- Exeter
- Exeter-South West
- Exmouth
- Glasgow
- Gloucester
- Hemel Hempstead
- Hereford North
- Hull
- Ipswich
- Leeds
- Leicester
- Leicester-City Centre
- Liverpool
- London-Acton
- London-Aldgate
- London-Barnet
- London-Beckenham
- London-Bermondsey
- London-Bromley
- London-Central
- London-Chigwell
- London-Clapham
- London-Croydon
- London-Ealing
- London-East Ham
- London-Enfield
- London-ExCeL
- London-Finsbury Park
- London-Greenford
- London-Hanwell
- London-Hayes-and-Southall
- London-Holborn
- London-Ilford
- London-Kennington
- London-Kingston Upon Thames
- London-Mile-End
- London-Park Royal
- London-Putney
- London-Ruislip
- London-Russell Square
- London-South Croydon
- London-Tottenham Court Rd
- London-Uxbridge
- London-Wembley
- London-Westminster
- London-Wimbledon
- London-Wood Green
- London-Woolwich
- Luton
- Manchester
- Manchester-Central
- Manchester-Piccadilly
- Middlesbrough
- Milton Keynes
- Milton Keynes-Central
- Newcastle Upon Tyne
- Newcastle upon Tyne- Central
- Newport
- Northampton
- Norwich
- Nottingham
- Nottingham-City Centre
- Nottingham-Derby
- oban
- Omagh
- Peterborough
- Plymouth
- Portsmouth
- Preston
- Reading
- Salisbury
- Sheffield
- Slough
- Southampton
- Stoke-on-Trent
- Swansea
- Swindon
- Telford
- Wakefield
- Watford
- Wiltshire
- Winchester
- Wolverhampton
- Worcester
- Andover
- Barnsley
- Belfast
- Birmingham
- Bolton-Breightmet Street
- Bournemouth
- Bradford
- Brentwood
- Brighton
- Bristol
- Cardiff
- Chelmsford
- Chester
- Coventry
- Derby
- Edinburgh
- Glasgow
- Hereford North
- Leeds
- Leicester
- Liverpool
- London-Central
- London-Chigwell
- London-Croydon
- London-Finsbury Park
- London-Greenford
- London-Holborn
- London-Holborn-Central
- London-Ilford
- London-Kensington
- London-Ruislip
- London-Russell Square
- London-Tottenham Court Rd
- London-Wembley
- London-Westminster
- London-Wood Green
- London-Woolwich
- Luton
- Manchester
- Manchester-Central
- Milton Keynes
- Milton Keynes-Central
- Newcastle Upon Tyne
- Newport
- Northampton
- Norwich
- Nottingham
- Plymouth
- Portsmouth
- Preston
- Salisbury
- Sheffield
- Slough
- Southampton
- Stoke-on-Trent
- Swansea
- Swindon
- Telford
- Wakefield
- Winchester
- Worcester
- Zoom
- Birmingham
- Birmingham-Central Tyseley
- Birmingham-Edgbaston
- Bradford
- Bristol
- Cardiff
- Chester
- Coventry
- Hull
- Leeds
- Leicester
- Liverpool
- London-Aldgate
- London-Central
- London-East Ham
- London-ExCeL
- London-Holborn
- London-Kingston Upon Thames
- London-Mile-End
- London-Russell Square
- London-Tottenham Court Rd
- London-Westminster
- Manchester
- Newcastle Upon Tyne
- Newport
- Nottingham-City Centre
- oban
- Portsmouth
- Reading
- Reading-City Centre
- Sheffield-City Centre
- Slough
- Stoke-on-Trent
- Andover
- Ashford
- Aylesbury
- Barnsley
- Basingstoke
- Belfast
- Birmingham
- Birmingham-Central
- Birmingham-Central Tyseley
- Bolton
- Bolton-Breightmet Street
- Bournemouth
- Bradford
- Brentwood
- Brighton
- Bristol
- Bushey
- Cambridge
- Cardiff
- Chatham
- Chelmsford
- Cheltenham
- Chester
- Colchester
- Coventry
- Crawley
- Derby
- Edinburgh
- Exeter
- Exmouth
- Glasgow
- Gloucester
- Guildford
- Hemel Hempstead
- Hereford North
- Hull
- Ipswich
- Leeds
- Leeds Central
- Leicester-City Centre
- Liverpool
- London-Acton
- London-Aldgate
- London-Barnet
- London-Beckenham
- London-Bermondsey
- London-Bromley
- London-Central
- London-Chigwell
- London-Clapham
- London-Croydon
- London-Dagenham
- London-East Ham
- London-Enfield
- London-ExCeL
- London-Finsbury Park
- London-Greenford
- London-Hayes-and-Southall
- London-Holborn
- London-Holborn-Central
- London-Ilford
- London-Kennington
- London-Kensington
- London-Kingston Upon Thames
- London-Mile-End
- London-Park Royal
- London-Putney
- London-Romford
- London-Ruislip
- London-Russell Square
- London-Stratford
- London-Tottenham Court Rd
- London-Uxbridge
- London-Wembley
- London-Wimbledon
- London-Wood Green
- London-Woolwich
- Luton
- Manchester
- Manchester-Central
- Manchester-Piccadilly
- Middlesbrough
- Milton Keynes
- Milton Keynes-Central
- Newcastle Upon Tyne
- Newcastle upon Tyne- Central
- Newport
- Northampton
- Norwich
- Nottingham
- oban
- Oldham
- Peterborough
- Plymouth
- Portsmouth
- Preston
- Reading
- Salisbury
- Sheffield
- Slough
- Southampton
- Southend On Sea
- Stoke-on-Trent
- Swindon
- Telford
- Wakefield
- Watford
- Wiltshire
- Winchester
- Woking
- Wolverhampton
- Worcester
- Andover
- Birmingham
- Bolton-Breightmet Street
- Bournemouth
- Bristol
- Cardiff
- Chester
- Coventry
- Derby
- Glasgow
- Hereford North
- Leeds
- Leicester
- Liverpool
- London-Aldgate
- London-Brixton
- London-Central
- London-East Ham
- London-ExCeL
- London-Finsbury Park
- London-Holborn
- London-Kensington
- London-Mile-End
- London-Russell Square
- London-Tottenham Court Rd
- London-Wood Green
- Manchester
- Newcastle Upon Tyne
- Newport
- Nottingham
- oban
- Portsmouth
- Salisbury
- Sheffield
- Slough
- Southampton
- Telford
- Winchester
- Worcester
ALL CAREERS
- ARC Operator
- Area Relief Security Officer
- Close Protection Officer
- Control Room Operator
- Corporate Security Officer
- Distribution Security Officer
- Front of House Officer
- Key Response Officer
- Loading Bay Supervisor
- Mobile Security Supervisor
- Night Shift Security Officer
- Nightclub Doorman
- Retail Security Officer
- Security Command Centre Manager
- Security Concierge
- Security Manager
- Security Patrol Officer
- Static Security Officer
- Venue Security Officer

The Reoffending Report: UK Reoffending Statistics and Regional Insights
by Get Licensed | May 14, 2025 | Reading Time: 5 mins

While preventing crime is the justice system’s primary goal, reoffending remains a significant issue. Despite ongoing reforms, reoffending rates in the UK remain a significant challenge, highlighting issues around rehabilitation, support services, and systemic inequality within the justice system.
Around a quarter (26.3%) of offenders go on to reoffend, though this varies significantly by region and demographics. For some, access to practical qualifications — such as an SIA licence — can play a vital role in reducing reoffending by opening up employment opportunities and supporting a more stable reintegration into society.
At Get Licensed, we believe that access to meaningful employment can be a turning point. This report explores the demographics, offence types, and regional patterns of reoffending and highlights how skills-based training, like our SIA door supervisor course, can help individuals move toward a more stable and lawful future.
An Overview of Reoffending Trends
The latest figures on reoffending in England and Wales, covering April 2022 to March 2023, reveal that just over a quarter (26.3%) of offenders went on to reoffend.
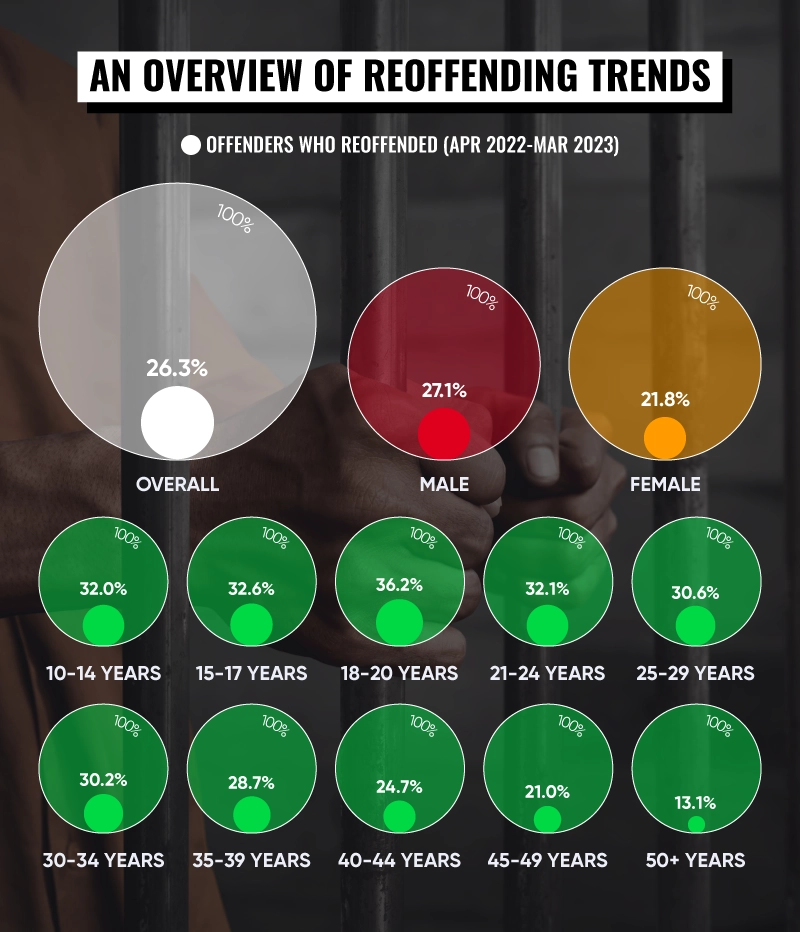
Gender Breakdown
- Male offenders had a reoffending rate of 27.1%
- Female offenders reoffended at a significantly lower rate of 21.8%.
Age Trends
- Reoffending rates in the UK are notably higher among younger age groups and tend to decline steadily with age.
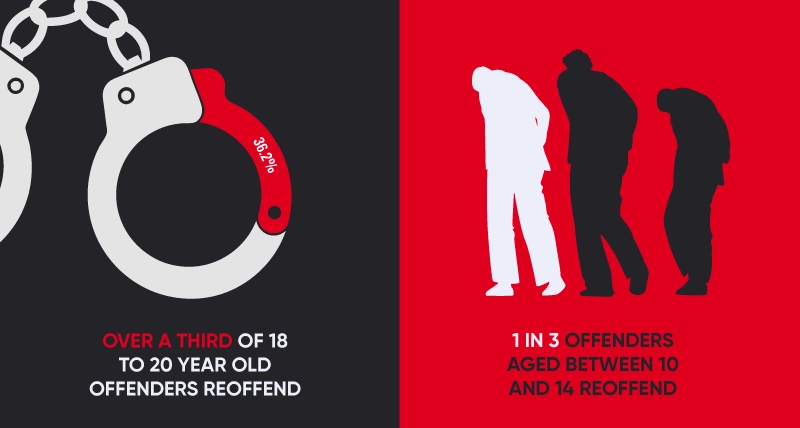
- The highest reoffending rate was recorded among those aged 18 to 20, with more than one in three (36.2%) going on to reoffend.
- Those aged 15 to 17 and 10 to 14 also had higher rates, at roughly one in three (32.6% and 32.0% respectively).
- Reoffending stayed above 30% up to the 30–34 age bracket before declining sharply.
- It dropped to 24.7% for those aged 40–44, 21.0% for 45–49-year-olds, and just 13.1% for those aged 50 and over.
Which Offence Types See the Highest Reoffending Rates in the UK?
| Rank | Offence type | Offenders who reoffended |
|---|---|---|
| 1 | Theft | 48.4% |
| 2 | Public Order | 36.0% |
| 3 | Miscellaneous Crimes Against Society | 33.2% |
| 4 | Criminal Damage and Arson | 27.7% |
| 5 | Summary Non-motoring | 27.5% |
| 6 | Possession of Weapons | 27.3% |
| 7 | Drug | 23.9% |
| 8 | Robbery | 23.7% |
| 9 | Violence Against the Person | 23.2% |
| 10 | Sexual | 15.9% |
| 11 | Summary Motoring | 13.7% |
| 12 | Fraud | 11.5% |
When we look at the likelihood of reoffending by offence type, theft offences top the list by a significant margin, with nearly half (48.4%) of individuals committing theft going on to reoffend. This could be due to a link between reoffending and crimes that are linked to socio-economic factors like poverty, addiction, or lack of support.
Public order offences follow with a reoffending rate of more than one in three (36.0%), suggesting that reoffending happens across a broad range of offences. Miscellaneous crimes against society, which may include offences like perverting the course of justice or handling stolen goods, have a reoffending rate of 33.2%.
Crimes involving criminal damage and arson (27.7%) and summary non-motoring offences (27.5%) — such as common assault or being drunk and disorderly.
Interestingly, offences that are typically considered more severe or violent, such as robbery (23.7%), violence against the person (23.2%), and drug offences (23.9%), show lower reoffending rates in the UK. This could be due to longer sentences and more targeted rehabilitation.
At the lower end of the spectrum, sexual offences (15.9%) and summary motoring offences (13.7%) have some of the lowest rates of reoffending, with fraud offences seeing the least likelihood of repeat offending at just 11.5%.
How Do the Most Common Offences Differ By Region?
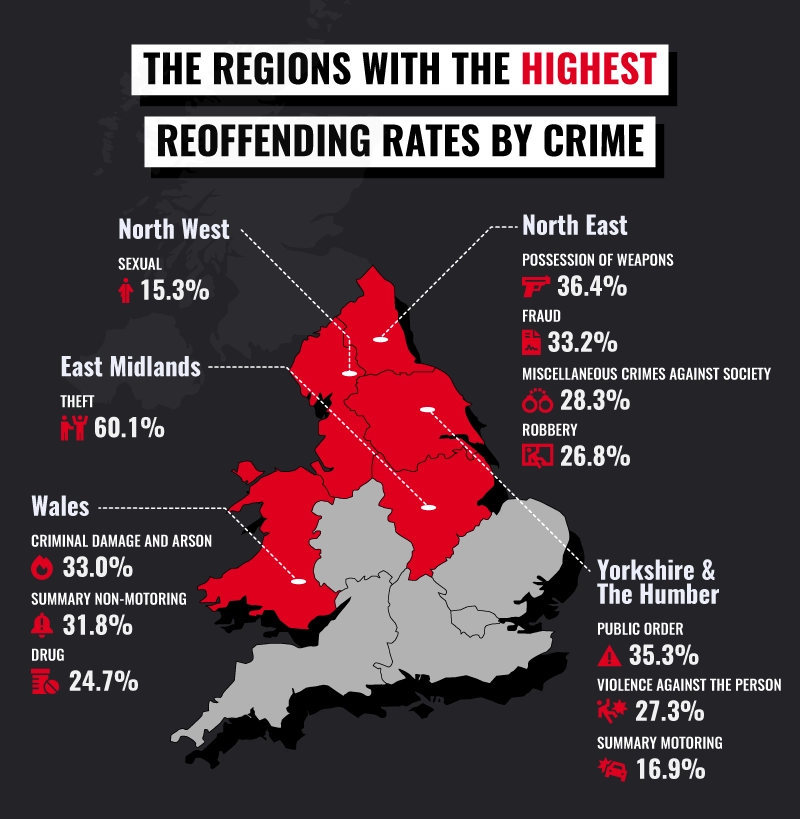
The highest reoffending rates in the UK are found in Wales and northern regions like the North East and Yorkshire and the Humber for many offence types.
For example:
- Wales tops the list for criminal damage and arson at 33.0% and has exceptionally high rates for summary non-motoring offences (31.8%) and theft (59.2%).
- The North East stands out for fraud (33.2%), miscellaneous crimes against society (28.3%), and possession of weapons (36.4%).
- Yorkshire and the Humber show some of the most consistently high rates, with public order (35.3%) and theft (59.3%) among the highest in England.
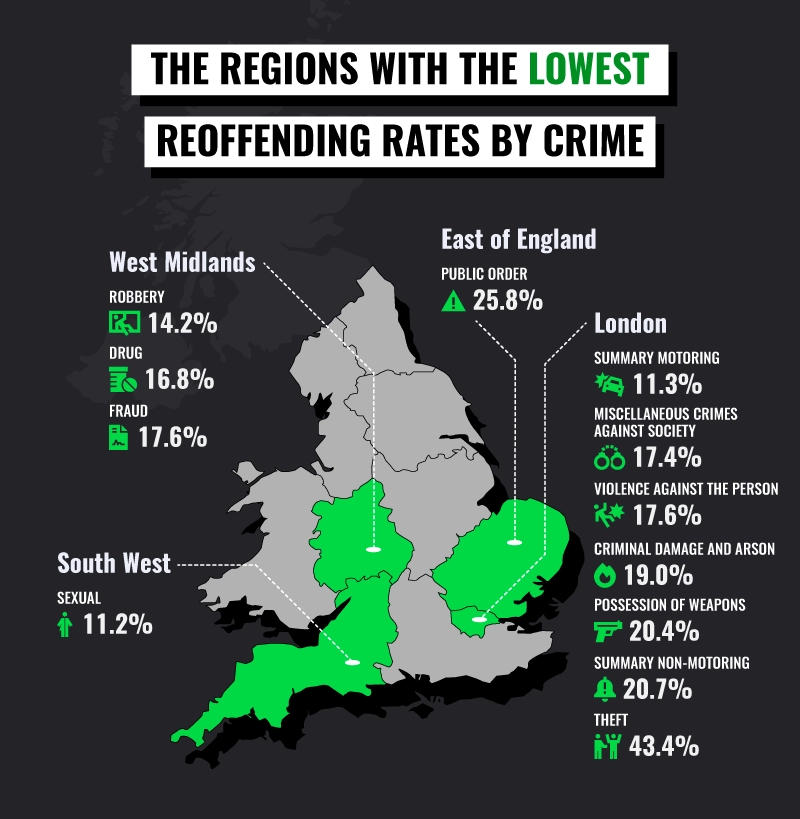
On the other hand, the South and Midlands tend to have lower reoffending rates for most offences.
For example:
- London has the lowest offending rate for summary motoring (11.3%), violence (17.6%), and theft (43.4%).
- Despite generally lower crime levels, the South West has higher reoffending rates for criminal damage (31.2%) and possession of weapons (31.5%).
- The West Midlands records the lowest drug reoffending rate at 16.8%, potentially due to more effective drug prevention and rehabilitation schemes.
- However, the East Midlands ranks highest for theft (60.1%) — the single highest rate for any offence across the regions.
The Areas Struggling The Most with Repeat Offenders
There are also notable differences in reoffending rates across the UK, with some areas having much higher proportions of offenders committing another crime.
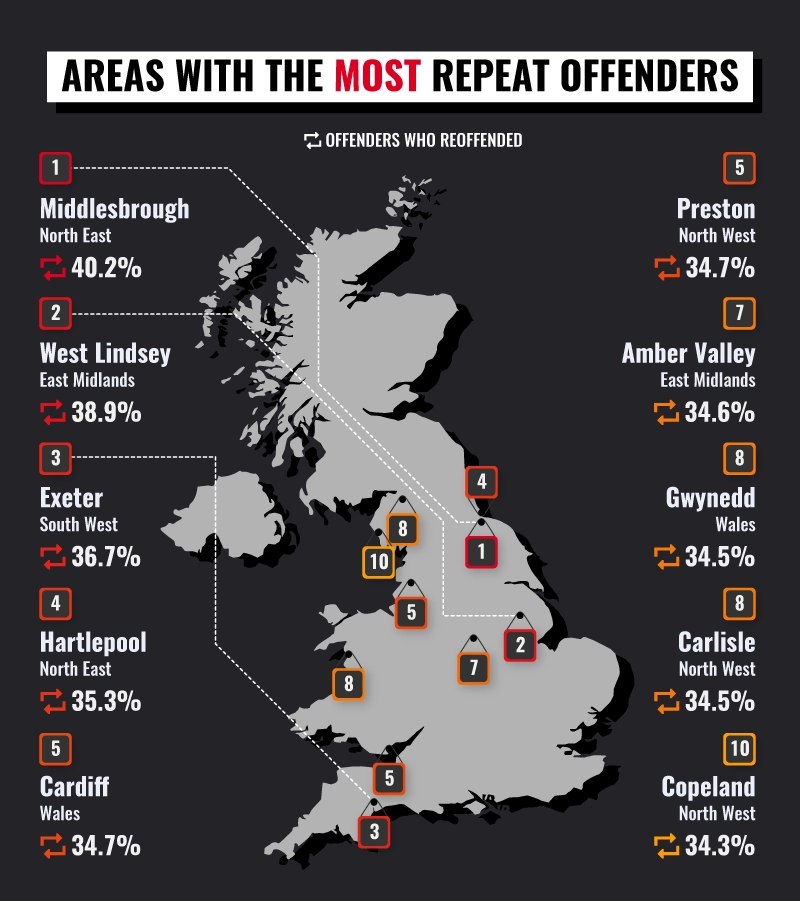
Middlesbrough tops the list with the highest reoffending rate, where two in five (40.2%) offenders go on to reoffend. West Lindsey in the East Midlands (38.9%) and Exeter in the South West (36.7%) follow closely behind.
Regionally, the North East is a reoffending hotspot, with Hartlepool (35.3%), Redcar and Cleveland (32.4%), and Stockton-on-Tees (31.3%) all appearing within the top third of the rankings.
Welsh areas also feature prominently, with Cardiff (34.7%), Gwynedd (34.5%), and Merthyr Tydfil (32.7%) all recording some of the UK's highest reoffending rates.
The Areas With the Fewest Repeat Offenders
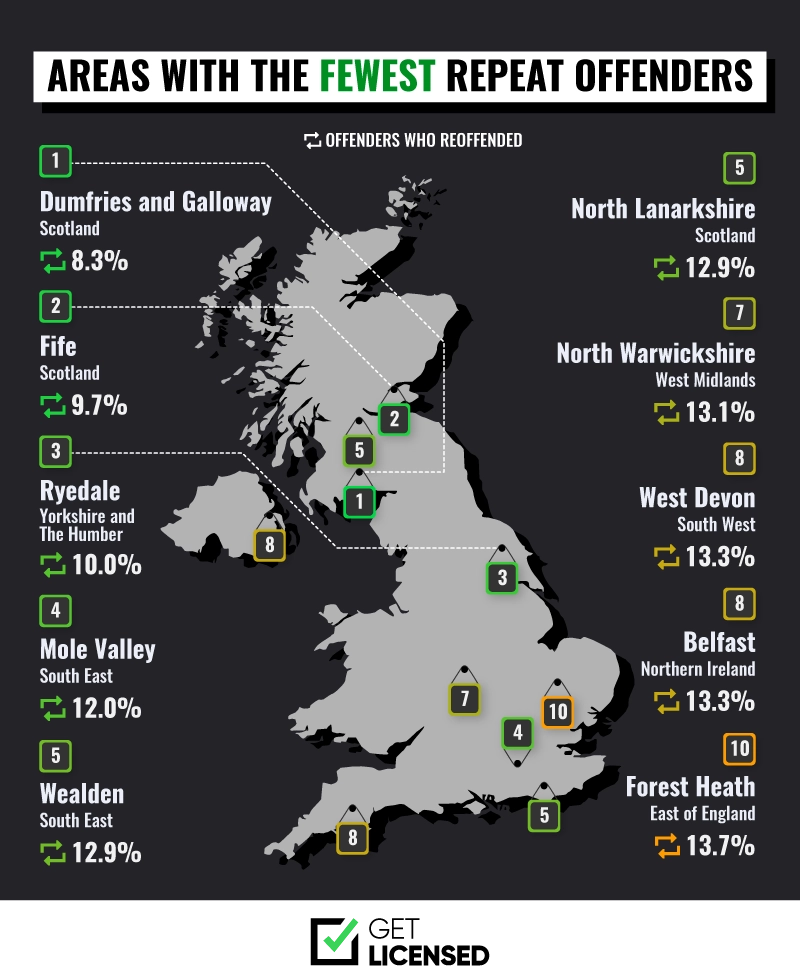
At the other end of the scale, Scotland and rural parts of England record the lowest reoffending rates. Dumfries and Galloway has the lowest reoffending rate at fewer than one in ten (8.3%), followed by Fife (9.7%) and Ryedale in North Yorkshire (10.0%).
How Have Reoffending Rates in the UK Changed?
Reoffending rates have fluctuated in recent years, with short-term spikes and long-term declines revealing the complex impact of policy, support systems, and social change. The data shows both recent shifts and a broader 10-year trend.
Year-On-Year Comparison
| Offenders who reoffended | |||
|---|---|---|---|
| Apr 2021-Mar 2022 | Apr 2022-Mar 2023 | Relative difference | |
| Overall | 25.2% | 26.3% | 4.4% |
| Male | 26.1% | 27.1% | 3.8% |
| Female | 20.3% | 21.8% | 7.4% |
| 10 to 14 | 30.7% | 32.0% | 4.2% |
| 15 to 17 | 32.5% | 32.6% | 0.3% |
| 18 to 20 | 34.6% | 36.2% | 4.6% |
| 21 to 24 | 31.0% | 32.1% | 3.5% |
| 25 to 29 | 28.7% | 30.6% | 6.6% |
| 30 to 34 | 28.3% | 30.2% | 6.7% |
| 35 to 39 | 27.2% | 28.7% | 5.5% |
| 40 to 44 | 22.7% | 24.7% | 8.8% |
| 45 to 49 | 19.3% | 21.0% | 8.8% |
| 50+ | 12.4% | 13.1% | 5.6% |
Between Apr 2021–Mar 2022 and Apr 2022–Mar 2023, the overall reoffending rate rose slightly from 25.2% to 26.3%, a 4.4% increase (relative). This suggests a modest uptick in repeat offending following the pandemic period.
Gender Breakdown
- Male offenders rose from 26.1% to 27.1% (+3.8%).
- Female offenders increased from 20.3% to 21.8% (+7.4%), a sharper relative increase than male offenders.
Age Trends
- The highest reoffending rates in the UK remain among young offenders, particularly those aged 18–20 (36.2%) and 15–17 (32.6%).
- The most significant relative increases happened among 40–44 and 45–49 year-olds (+8.8% each), 30–34 year-olds (+6.7%), and 25–29 year-olds (+6.6%).
- Even the 10–14 age group saw a notable rise from 30.7% to 32.0% (+4.2%).
Long-Term Trends
| Offenders who reoffended | |||
|---|---|---|---|
| Apr 2012-Mar 2013 | Apr 2022-Mar 2023 | Relative difference | |
| Overall | 30.9% | 26.3% | -14.9% |
| Male | 32.7% | 27.1% | -17.1% |
| Female | 22.8% | 21.8% | -4.4% |
| 10 to 14 | 39.6% | 32.0% | -19.2% |
| 15 to 17 | 41.5% | 32.6% | -21.4% |
| 18 to 20 | 34.6% | 36.2% | 4.6% |
| 21 to 24 | 30.5% | 32.1% | 5.2% |
| 25 to 29 | 31.3% | 30.6% | -2.2% |
| 30 to 34 | 32.0% | 30.2% | -5.6% |
| 35 to 39 | 30.4% | 28.7% | -5.6% |
| 40 to 44 | 26.1% | 24.7% | -5.4% |
| 45 to 49 | 22.7% | 21.0% | -7.5% |
| 50+ | 15.3% | 13.1% | -14.4% |
The data shows a notable decline in reoffending over the past decade. Reoffending dropped from 30.9% to 26.3%, a 14.9% decrease.
Gender Breakdown
- Male reoffending has fallen substantially, from 32.7% to 27.1% (-17.1%).
- Female reoffending has declined less, from 22.8% to 21.8% (-4.4%).
Age Trends
- The most significant long-term reductions are among 15–17-year-olds (-21.4%), 10–14-year-olds (-19.2%), and 50+ (-14.4%).
- Most other age groups have also seen moderate declines.
- However, 18–24-year-olds are the only groups to have seen increases.
From Reoffending to Reintegration
While certain areas may be considered the UK’s crime capitals, reoffending rates in the UK are more nuanced. Reducing reoffending is not just a justice system issue — it’s a societal one. This report shows that certain areas and groups are disproportionately affected, often due to underlying social inequalities. However, the data also reveals where progress is being made.
At Get Licensed, we see firsthand how access to training and employment can make a real difference. Whether it’s through our SIA licence courses like security guard training, door supervisor training, and CCTV training, or the GuardPass jobs platform, we help people take steps toward a better future. By providing pathways into secure and rewarding work, we aim to play our part in breaking the cycle of reoffending.
Methodology
- All data was sourced from the Ministry of Justice’s proven reoffending statistics, January to March 2023, using the annual average tables from April 2022 to March 2023.
- The data covers individuals who were released from custody, received a non-custodial conviction at court, or were given a caution during this period.
- Unless otherwise stated, all data refers to the most recent 12-month period, from April 2022 to March 2023.
- A proven reoffence is defined as an offence committed within a one-year follow-up period that results in a court conviction, caution, reprimand, or warning. This can also include offences proven within a further six-month waiting period to allow court proceedings to conclude.
- Local authority and regional data are based on the offender’s most recent known address. This may include individuals whose last known address was in Scotland or Northern Ireland but who committed an offence in England or Wales.
Launch your career as a
Security Guard in the UK
Learn how to start your career in UK security industry.
Explore Courses


Find work, try mock tests and book courses from
the UK’s #1 app for security professionals


Get Licensed helps you get SIA trained, licensed, and ready for real security jobs — trusted by 450,000+ people across the UK.


