
 Trustpilot


POPULAR COURSES

ALL COURSES
- L2 Award for Cash And Valuables In Transit (CViT)
- Security Drone Pilot
- Security Screening BS7858
- SIA CCTV Operator Training
- SIA Close Protection Training
- SIA Door Supervisor Training
- SIA Security Guard Training
- SIA Top-Up Refresher Training for Close Protection
- SIA Top-Up Refresher Training for Door Supervisor
- SIA Top-Up Refresher Training for Security Guard
- Use of Mechanical Restraints (Handcuffs) - L3 Award
POPULAR LICENCES
ALL LICENCES
- Cash and Valuables in Transit (CVIT) Licence
- CCTV Licence
- Close Protection Licence
- How to get an SIA Licence
- Key Holding Licence
- Security Guard Licence
- SIA Door Supervisor Licence
- SIA Licence Bangladesh Passport
- SIA Licence Ghanaian Passport
- SIA Licence Indian Passport
- SIA Licence Irish Passport
- SIA Licence Nigerian Passport
- SIA Licence on Pakistani Passport
- SIA Licence Poland Passport
- SIA Licence Romanian Passport
- SIA Licence South African Passport
POPULAR COURSES
ALL LOCATIONS
- Andover
- Ashford
- Aylesbury
- Barnsley
- Basingstoke
- Belfast
- Birmingham
- Birmingham-Central
- Birmingham-Central Tyseley
- Birmingham-Edgbaston
- Blackburn
- Bournemouth
- Bradford
- Brentwood
- Brighton
- Bristol
- Burnley
- Bushey
- Cambridge
- Cardiff
- Carlisle
- Chatham
- Chelmsford
- Cheltenham
- Chester
- Colchester
- Coventry
- Crawley
- Crawley-Central
- Derby
- Dundee
- Durham
- Edinburgh
- Exeter
- Exeter-South West
- Exmouth
- Glasgow
- Gloucester
- Hemel Hempstead
- Hereford North
- Hull
- Ipswich
- Leeds
- Leicester
- Leicester-City Centre
- Liverpool
- London-Acton
- London-Aldgate
- London-Barnet
- London-Beckenham
- London-Bermondsey
- London-Bromley
- London-Central
- London-Chigwell
- London-Clapham
- London-Croydon
- London-Ealing
- London-East Ham
- London-Enfield
- London-ExCeL
- London-Finsbury Park
- London-Greenford
- London-Hanwell
- London-Hayes-and-Southall
- London-Holborn
- London-Ilford
- London-Kennington
- London-Kingston Upon Thames
- London-Mile-End
- London-Park Royal
- London-Putney
- London-Ruislip
- London-Russell Square
- London-South Croydon
- London-Tottenham Court Rd
- London-Uxbridge
- London-Wembley
- London-Westminster
- London-Wimbledon
- London-Wood Green
- London-Woolwich
- Luton
- Manchester
- Manchester-Central
- Manchester-Piccadilly
- Middlesbrough
- Milton Keynes
- Milton Keynes-Central
- Newcastle Upon Tyne
- Newcastle upon Tyne- Central
- Newport
- Northampton
- Norwich
- Nottingham
- Nottingham-City Centre
- Nottingham-Derby
- oban
- Omagh
- Peterborough
- Plymouth
- Portsmouth
- Preston
- Reading
- Salisbury
- Sheffield
- Slough
- Southampton
- Stoke-on-Trent
- Swansea
- Swindon
- Telford
- Wakefield
- Watford
- Wiltshire
- Winchester
- Wolverhampton
- Worcester
- Andover
- Barnsley
- Belfast
- Birmingham
- Bolton-Breightmet Street
- Bournemouth
- Bradford
- Brentwood
- Brighton
- Bristol
- Cardiff
- Chelmsford
- Chester
- Coventry
- Derby
- Edinburgh
- Glasgow
- Hereford North
- Leeds
- Leicester
- Liverpool
- London-Central
- London-Chigwell
- London-Croydon
- London-Finsbury Park
- London-Greenford
- London-Holborn
- London-Holborn-Central
- London-Ilford
- London-Kensington
- London-Ruislip
- London-Russell Square
- London-Tottenham Court Rd
- London-Wembley
- London-Westminster
- London-Wood Green
- London-Woolwich
- Luton
- Manchester
- Manchester-Central
- Milton Keynes
- Milton Keynes-Central
- Newcastle Upon Tyne
- Newport
- Northampton
- Norwich
- Nottingham
- Plymouth
- Portsmouth
- Preston
- Salisbury
- Sheffield
- Slough
- Southampton
- Stoke-on-Trent
- Swansea
- Swindon
- Telford
- Wakefield
- Winchester
- Worcester
- Zoom
- Birmingham
- Birmingham-Central Tyseley
- Birmingham-Edgbaston
- Bradford
- Bristol
- Cardiff
- Chester
- Coventry
- Hull
- Leeds
- Leicester
- Liverpool
- London-Aldgate
- London-Central
- London-East Ham
- London-ExCeL
- London-Holborn
- London-Kingston Upon Thames
- London-Mile-End
- London-Russell Square
- London-Tottenham Court Rd
- London-Westminster
- Manchester
- Newcastle Upon Tyne
- Newport
- Nottingham-City Centre
- oban
- Portsmouth
- Reading
- Reading-City Centre
- Sheffield-City Centre
- Slough
- Stoke-on-Trent
- Andover
- Ashford
- Aylesbury
- Barnsley
- Basingstoke
- Belfast
- Birmingham
- Birmingham-Central
- Birmingham-Central Tyseley
- Bolton
- Bolton-Breightmet Street
- Bournemouth
- Bradford
- Brentwood
- Brighton
- Bristol
- Bushey
- Cambridge
- Cardiff
- Chatham
- Chelmsford
- Cheltenham
- Chester
- Colchester
- Coventry
- Crawley
- Derby
- Edinburgh
- Exeter
- Exmouth
- Glasgow
- Gloucester
- Guildford
- Hemel Hempstead
- Hereford North
- Hull
- Ipswich
- Leeds
- Leeds Central
- Leicester-City Centre
- Liverpool
- London-Acton
- London-Aldgate
- London-Barnet
- London-Beckenham
- London-Bermondsey
- London-Bromley
- London-Central
- London-Chigwell
- London-Clapham
- London-Croydon
- London-Dagenham
- London-East Ham
- London-Enfield
- London-ExCeL
- London-Finsbury Park
- London-Greenford
- London-Hayes-and-Southall
- London-Holborn
- London-Holborn-Central
- London-Ilford
- London-Kennington
- London-Kensington
- London-Kingston Upon Thames
- London-Mile-End
- London-Park Royal
- London-Putney
- London-Romford
- London-Ruislip
- London-Russell Square
- London-Stratford
- London-Tottenham Court Rd
- London-Uxbridge
- London-Wembley
- London-Wimbledon
- London-Wood Green
- London-Woolwich
- Luton
- Manchester
- Manchester-Central
- Manchester-Piccadilly
- Middlesbrough
- Milton Keynes
- Milton Keynes-Central
- Newcastle Upon Tyne
- Newcastle upon Tyne- Central
- Newport
- Northampton
- Norwich
- Nottingham
- oban
- Oldham
- Peterborough
- Plymouth
- Portsmouth
- Preston
- Reading
- Salisbury
- Sheffield
- Slough
- Southampton
- Southend On Sea
- Stoke-on-Trent
- Swindon
- Telford
- Wakefield
- Watford
- Wiltshire
- Winchester
- Woking
- Wolverhampton
- Worcester
- Andover
- Birmingham
- Bolton-Breightmet Street
- Bournemouth
- Bristol
- Cardiff
- Chester
- Coventry
- Derby
- Glasgow
- Hereford North
- Leeds
- Leicester
- Liverpool
- London-Aldgate
- London-Brixton
- London-Central
- London-East Ham
- London-ExCeL
- London-Finsbury Park
- London-Holborn
- London-Kensington
- London-Mile-End
- London-Russell Square
- London-Tottenham Court Rd
- London-Wood Green
- Manchester
- Newcastle Upon Tyne
- Newport
- Nottingham
- oban
- Portsmouth
- Salisbury
- Sheffield
- Slough
- Southampton
- Telford
- Winchester
- Worcester
ALL CAREERS
- ARC Operator
- Area Relief Security Officer
- Close Protection Officer
- Control Room Operator
- Corporate Security Officer
- Distribution Security Officer
- Front of House Officer
- Key Response Officer
- Loading Bay Supervisor
- Mobile Security Supervisor
- Night Shift Security Officer
- Nightclub Doorman
- Retail Security Officer
- Security Command Centre Manager
- Security Concierge
- Security Manager
- Security Patrol Officer
- Static Security Officer
- Venue Security Officer

The State of Firearm Ownership in England and Wales
by Get Licensed | Aug 18, 2025 | Reading Time: 10 mins
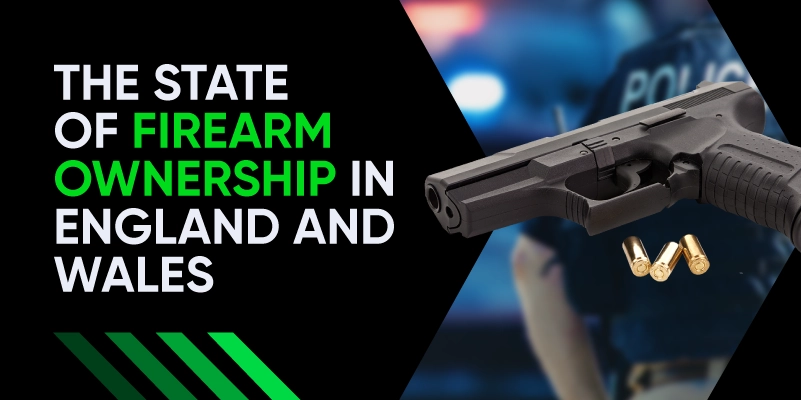
Firearm ownership in England and Wales is quietly changing.
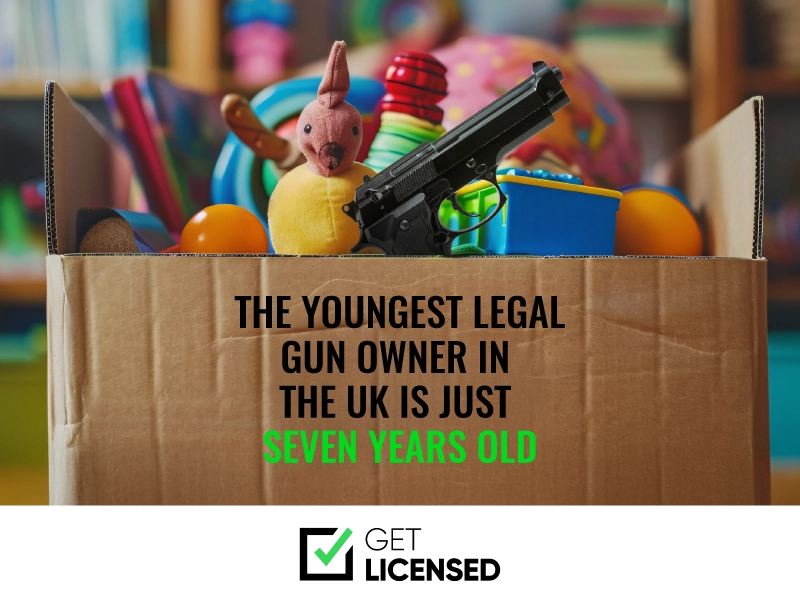
While the total number of licensed guns is falling, the number of certificates per capita is rising, and a growing number of those certificate holders are under 18. The youngest? Just seven years old, according to Government statistics.
But it’s not just legal firearms shaping the future of UK weapon ownership. A more urgent threat is emerging: 3D-printed ‘ghost guns’. Cheap, untraceable, and made using blueprints downloaded from the internet, these weapons are slipping through the cracks of legislation and law enforcement. 1
Public interest in them is also soaring, with an average of over 100,000 people searching for information on 3D-printed guns online each year. 2
Get Licensed trains frontline staff to prepare for these evolving risks. After undertaking leading SIA door supervisor training, our trainees are often the first line of defence when weapons enter public spaces.
To shine a light on the growing threat facing the industry, this report builds on to the research shared in our UK Firearam Report (2024), and breaks down the most recent findings on:
- Who owns firearms in the UK, analysing data by age, gender, and region
- Where gun licences are most and least common
- How gun crime and weapon seizures are changing
- What the rise of 3D-printed guns could mean for public safety
Note: All figures in this report are from the end of the financial year stated (March 31st).
Legal Firearm Ownership in England and Wales
The Number of Firearm and Shotgun Certificates Issued
Despite the UK’s strict gun laws and a long-term decline in licence numbers, firearm ownership is rising relative to the population.
In 2024/25, 145,306 firearm certificates were issued in England and Wales, down 1.4% from the year prior. However, when measured per capita, firearm ownership in the UK has reached its highest level in several years, with 1,029 certificates per 100,000 people.
When we compare 2024/25 to averages across the 10 years studied, these trends are more pronounced, with a 5.2% decrease in certificates issued but 31 more firearms per 100,000.
| Year | Firearm certificates issued* | Firearms per 100,000 people* |
|---|---|---|
| 2015-2025 | 153,258 | 998 |
| 2024/25 | 145,306 | 1,029 |
To legally own a firearm or shotgun in the UK, applicants must:
- Apply through their local police force and show “good reason” for why they need to possess one (e.g. farmers for livestock protection and pest control)
- Provide one or two referees who can vouch for their character
- Pass background and medical checks
- Meet safe storage requirements for weapons and ammunition
The UK maintains some of the most stringent firearm laws globally, and while ownership remains relatively low, the data shows that it continues to be a consistent presence across parts of the population.
How Has the Number of Firearms Certificates Changed Over Time?
Over the past decade, the number of people legally holding firearm certificates in England and Wales has declined gradually, down 5.4% since 2014/15*. However, the rate of ownership per 100,000 people has crept up, suggesting that while gun ownership is slowly falling, the reality is that these types of weapons have more of a presence in UK communities than before.
| Year | Firearm certificates issued | Firearms per 100,000 people |
|---|---|---|
| 2014/15 | 153,603 | 915 |
| 2015/16 | 153,404 | 931 |
| 2016/17 | 154,958 | 958 |
| 2017/18 | 157,581 | 983 |
| 2018/19 | 159,745 | 1,009 |
| 2019/20 | 159,483 | 1,025 |
| 2020/21 | 156,033 | 1,038 |
| 2021/22 | 151,218 | 1,042 |
| 2022/23 | 147,140 | 1,022 |
| 2023/24 | 147,364 | 1,026 |
| 2024/25 | 145,306 | 1,029 |
- Firearm certificates have decreased over the last 10 years, from 153,603 in the 2014/15 financial year to 145,306 in the 2024/25 financial year. This is a decrease of just over 8,000, or about 5.4%.
- The number of firearms certificates peaked in the 2018/19 financial year, with almost 160,000 across the UK.
- The five-year change in firearms certificates decreased by 6.9%, from 156,033 in the 2020/21 financial year to 145,306.
- Despite the decrease in firearms certificates, the number of firearms per capita has increased over the last 10 years, rising from 915 to 1,029 per 100,000 people.
*Calculated by comparing the 2014/15 data with the 2024/25 data in isolation, not averages across the period.
Certificate Holders by Age, Gender, and Police Force Area
Gun ownership in the UK isn’t spread evenly. Most certificate holders are older, overwhelmingly male, and concentrated in rural areas. In this section, we break down the data by age group, gender, and police force area, including some surprising stats about underage licence holders and where in the country gun ownership is most common.
Certificate Holders by Age
Before we explore this data in more depth, here are some need-to-knows about the UK's legal age requirements for firearm and shotgun licences.
- There is no minimum age for shotgun licences
- Anyone over 13 can apply for a firearm licence
These rules mean children can hold gun licences in the UK, provided they meet certain conditions. For example, anyone under 15 must be supervised when using a shotgun.
| Certificate holders as of 31 March 2025 | |||
|---|---|---|---|
| Age group | Firearm certificate holders | Shotgun certificate holders | Total certificate holders |
| Age 13 and under | - | 66 | 66 |
| Age 14 to 17 | 155 | 957 | 979 |
| Age 18 to 34 | 16,011 | 55,611 | 56,577 |
| Age 35 to 49 | 30,067 | 93,938 | 95,934 |
| Age 50 to 64 | 52,813 | 169,944 | 174,916 |
| Age 65 and over | 46,226 | 162,088 | 168,432 |
- Currently, 66 children under 13 have shotgun licences, and nearly 1,000 teens aged 14-17 hold either a firearm or shotgun certificate.
- The youngest legal gun owner in the UK is just seven years old.
- The age group holding the most certificates for a firearm or shotgun is between 50 and 64, with almost 175,000 certificates for people this age.
Certificate Holders by Gender
| Type of certificate | |||
|---|---|---|---|
| Firearm | Shotgun | Firearm and/or shotgun | |
| Males | 140,166 | 452,153 | 465,157 |
| Females | 5,106 | 30,451 | 31,747 |
| Males | 96.49% | 93.69% | 93.61% |
| Females | 3.51% | 6.31% | 6.39% |
- Males hold the vast majority of gun licences in the UK. Over 96% of firearm certificate holders and nearly 94% of shotgun certificate holders are male.
- Females account for just 6.4% of all firearm or shotgun license holders – roughly one in every 15.
This data on stark gender imbalances suggests two things.
- With just 6.4% of license holders being female, it highlights how firearms ownership is still a niche, male-leaning phenomenon, likely due to cultural and historical factors (shooting sports, hunting, etc.), along with occupations, such as farming and gamekeeping, traditionally being male-dominated.
- Imbalances could inform how firearm training courses are designed and who gun safety campaigns target.
Certificate Holders by Area
| Rank | Police force area | Total new applications completed (2024/25) | Firearm certificates issued | Firearms per 100,000 people |
|---|---|---|---|---|
| 1 | North Yorkshire | 283 | 6,588 | 3,029 |
| 2 | Dyfed-Powys | 249 | 4,488 | 2,977 |
| 3 | Cumbria | 197 | 3,188 | 2,453 |
| 4 | Norfolk | 159 | 4,923 | 2,225 |
| 5 | West Mercia | 322 | 6,932 | 2,120 |
| 6 | Devon and Cornwall | 735 | 10,248 | 2,099 |
| 7 | Suffolk | 82 | 4,221 | 2,077 |
| 8 | Wiltshire | 159 | 3,498 | 1,994 |
| 9 | Lincolnshire | 180 | 3,771 | 1,772 |
| 10 | Gloucestershire | 91 | 2,535 | 1,727 |
1. North Yorkshire has the highest rate of legal firearms certificates, with 6,588 issued in 2024/25
North Yorkshire has the highest rate of legal gun ownership in England and Wales, with 6,588 firearm certificates issued and 3,029 weapons per 100,000 people. As a largely rural region, this data aligns with what we know about the use of firearms for farming, livestock protection, pest control, and sport shooting.
Despite high levels of ownership, North Yorkshire has relatively few weapon offences. The Office for National Statistics recorded just 472 offences in 2024/25 – the ninth lowest in the country.
2. With 4,488 issued, the second-highest rate of firearms certificates is in Dyfed-Powys
Second on the list is Dyfed-Powys in Wales, with 4,488 licenses and 2,977 firearms per 100,000 people, including 249 new applications last year. Like North Yorkshire, Dyfed-Powys is a rural area where legal firearm use is naturally more common due to the prevalence of agricultural work.
The region also has one of the lowest rates of weapon offences, with just 414 incidents recorded – the third lowest in England and Wales.
3. Cumbria issued 3,188 firearms certificates in 2024/25, putting it in third place across England and Wales
Cumbria ranks third, with 3,188 certificates and 2,453 weapons per 100,000 people. Again, given this region's strong agricultural roots, license holders use firearms in the area for deer management, crop protection, and recreational shooting.
Although Cumbria has more offences than the top two regions, it still ranks low nationally. With 540 weapon offences recorded, it places 11th lowest across England and Wales.
What the Regional Firearms Data Tells Us
- Legal gun ownership is concentrated in rural areas like North Yorkshire and Cumbria, where firearms are used for farming, pest control, and sport.
- Despite high ownership, these areas have some of the lowest rates of weapon offences, showing that legal guns aren’t driving gun crime. This suggests responsible use and strong compliance with firearms regulations.
- It challenges the idea that more guns mean more danger. In the UK, legal firearm ownership and criminal misuse rarely overlap – most gun-related crime happens in urban areas using illegal firearms, which reaffirms the need for a robust monitoring and security infrastructure with professionals having passed SIA training courses.
Firearm Refusals and Revocations Have Risen by Over One-Third
The number of firearm applications refused or licences revoked has increased by 36.9% over the last decade, with refusals of renewals nearly quadrupling.
In 2024/25 alone:
- 334 new applications were refused
- 221 renewal applications were refused
- 542 licences were revoked
This rise reflects stricter vetting, increased involvement from GPs following a 2022 policy review, and growing concerns around mental health, addiction, and criminal history, all of which are common reasons for refusal or revocation. 3
| Year | New applications refused | Renewal applications refused | Revocations |
|---|---|---|---|
| 2015/16 | 221 | 58 | 396 |
| 2016/17 | 205 | 63 | 358 |
| 2017/18 | 217 | 77 | 345 |
| 2018/19 | 196 | 37 | 376 |
| 2019/20 | 217 | 50 | 371 |
| 2020/21 | 106 | 72 | 306 |
| 2021/22 | 158 | 80 | 385 |
| 2022/23 | 206 | 140 | 418 |
| 2023/24 | 414 | 229 | 507 |
| 2024/25 | 334 | 221 | 542 |
However, at a time when legally held firearms are under tighter control than ever, unregulated 3D-printed guns present an entirely different kind of threat. Skipping every safeguard in the system, these weapons:
- Bypass licensing entirely
- Have no oversight, no GP checks, no training initiatives, and no secure storage requirements
- Aren’t traceable, unlike licensed firearms
Firearm Offences in England and Wales: 10-Year Trends
Firearm-related crime in the UK remains relatively rare but hasn’t disappeared. Over the last decade, police have recorded an average of just over 6,000 offences involving firearms each year.
While the most recent figures show a decline, with 2024/25 marking a 10-year low, certain weapon types, especially imitation firearms and handguns, continue to feature in a significant number of incidents 4
| Principal weapon | Apr 2015 to Mar 2016 | Apr 2016 to Mar 2017 | Apr 2017 to Mar 2018 | Apr 2018 to Mar 2019 | Apr 2019 to Mar 2020 | Apr 2020 to Mar 2021 | Apr 2021 to Mar 2022 | Apr 2022 to Mar 2023 | Apr 2023 to Mar 2024 | Apr 2024 to Mar 2025 |
|---|---|---|---|---|---|---|---|---|---|---|
| Shotguns | 411 | 592 | 654 | 687 | 633 | 537 | 441 | 442 | 310 | 346 |
| Handguns | 2,157 | 2,685 | 2,867 | 2,763 | 2,629 | 2,133 | 1,799 | 1,919 | 1,889 | 1,665 |
| Rifles | 48 | 61 | 92 | 67 | 74 | 57 | 58 | 52 | 68 | 76 |
| Imitation firearms | 1,431 | 1,642 | 1,540 | 1,445 | 1,526 | 1,456 | 1,933 | 2,217 | 2,720 | 1,907 |
| Unidentified firearms | 666 | 844 | 869 | 1,172 | 989 | 938 | 1,061 | 978 | 1,029 | 762 |
| Other firearms | 469 | 551 | 508 | 747 | 814 | 623 | 479 | 452 | 433 | 347 |
| All firearms | 5,182 | 6,375 | 6,530 | 6,881 | 6,665 | 5,744 | 5,771 | 6,060 | 6,449 | 5,103 |
Key Takeaways From the Data on Firearms Offences
- Over the past decade, the UK has seen an average of just over 6,000 firearm-related offences per year, around 17 incidents a day.
- The 2024/25 financial year saw the fewest firearms offences, with 5,103, a decrease of just under 1,400 reported incidents compared to the previous financial year.
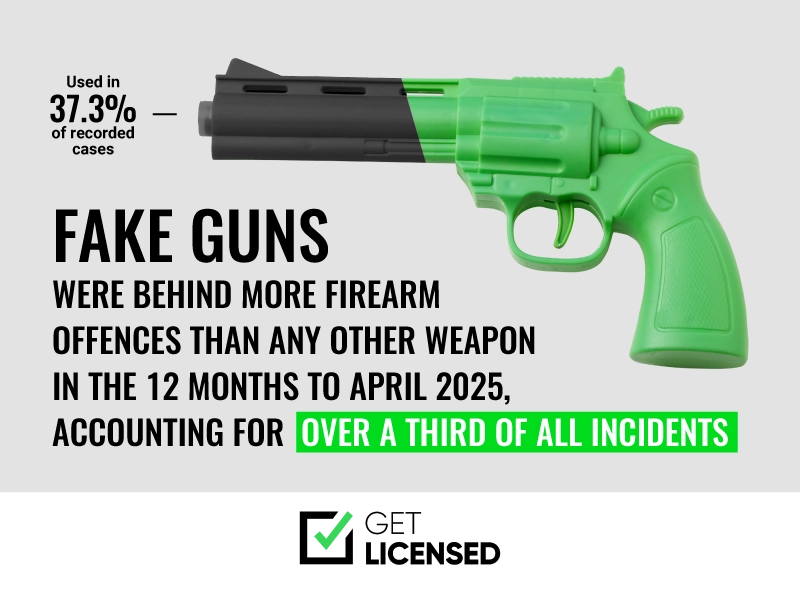
- Fake guns were behind more firearm offences than any other weapon in the 12 months to April 2025, accounting for over a third of all incidents. These imitation firearms, classed as anything that looks like a real firearm, regardless of whether it works, were used in 1,907 out of 5,103 (37.3%) recorded cases.
- Handguns accounted for 1,665 offences, the second-highest.
- Shotguns and rifles were used far less often, with 346 and 76 offences, respectively.
Firearms Offences by Area: The Safest and Most Dangerous Regions in England and Wales
While overall firearm crime in the UK remains relatively low, this data from 42 police force areas shows a clear concentration in a handful of urban regions, with some forces recording rates up to 25 times higher than the lowest.
The Highest and Lowest Firearm Offence Rates per 100,000 People
| Rank | Police force area | Total firearms offences* | Firearms offences per 100,000 people* |
|---|---|---|---|
| 1. | Cleveland | 148 | 26 |
| 2. | West Yorkshire | 626 | 26 |
| 3. | South Yorkshire | 309 | 22 |
| 4. | West Midlands | 576 | 20 |
| 5. | Greater Manchester | 494 | 17 |
| 37. | Cambridgeshire | 36 | 4 |
| 37. | Dyfed-Powys | 20 | 4 |
| 37. | South Wales | 49 | 4 |
| 40. | North Yorkshire | 28 | 3 |
| 40. | Wiltshire | 22 | 3 |
| 42. | Suffolk | 11 | 1 |
*Data is from April 2023 to March 2024 and excludes air weapons.
Key Insights From this Data:
- Urban force areas dominate the top of the list, with West Yorkshire and Cleveland jointly recording the highest rates of 26 offences per 100,000.
- Suffolk recorded just 11 offences in total, the lowest in England and Wales, despite being a sizeable county.
- North Yorkshire, which holds the highest rate of licensed firearm ownership, saw only 28 recorded firearm offences, reinforcing the point that high legal ownership does not mean high misuse.
- The Metropolitan Police saw the highest total number of firearm offences (1,248), but due to the capital’s large population, it ranks only 7th by rate per capita.
In practice, these low-crime areas help to contextualise the national picture: firearm crime in England and Wales is not widespread, but highly localised, typically confined to a small number of urban areas. This reinforces the value of targeted enforcement strategies and localised public safety measures, rather than blanket assumptions about where risk lies.
Prosecution Rates for Illegal Firearm Possession
While the UK has strict firearm laws and a relatively low rate of gun crime, prosecution rates for firearm offences remain surprisingly low.
The latest figures show that only 13.3% of cases involving lethal-barrelled or unidentified firearms (those capable of killing, such as handguns and shotguns) result in someone being charged or summonsed. For non-lethal weapons like BB guns and blank-firing replicas, that figure drops to just 10.4%.
This raises a key issue: even when firearm offences occur in the UK, many go unpunished, often because of evidential challenges or unidentified suspects.
| Lethal/unknown firearms | Non-lethal firearms | |
|---|---|---|
| Charged or summonsed | 13.3% | 10.4% |
| Evidential difficulties (victim does not support action) | 18.0% | 19.4% |
| Evidential difficulties (suspect identified; victim supports action) | 13.5% | 12.3% |
| Investigation complete - no suspect identified | 29.1% | 36.2% |
| Other | 1.9% | 6.7% |
| Offences not yet assigned an outcome | 24.3% | 15.0% |
| Total offences | 2,705 | 2,188 |
- Just one in seven offences involving lethal-barreled and unknown firearms were charged or summonsed.
- Approximately one-third (29.1%) of cases involving lethal firearms end with no suspect ever identified. This figure is even higher (36.2%) for non-lethal weapons.
- Over half of all cases involving non-lethal firearms don’t result in a charge, often due to a lack of evidence or victim cooperation.
- “Evidential difficulties”, such as lack of forensic evidence or witness withdrawal, affect nearly one in five cases.
What Does This Data Mean in Practice?
- Gun crime (like many other offences) doesn’t always lead to justice. Even in the most serious of cases, convictions are far from guaranteed.
- Imitation and non-lethal firearms still pose a significant threat to public safety, but they’re harder to prosecute.
- The enforcement gap underscores the importance of prevention via tighter licensing and SIA courses for frontline security workers.
How Do Firearm Prosecution Rates Compare to Other Types of Crimes in England and Wales?
| Crime type | Charged/summonsed |
|---|---|
| Violence against the person | 12% |
What This Data Shows:
- Weapons offences result in charges just 15% of the time, with one in five cases closed without finding a suspect.
- Robbery has the highest prosecution rate, but even then, only 18% of suspects are charged.
- Criminal damage and arson have the worst outcomes: in 77% of cases, no suspect is identified.
- Across almost all crime types, a lack of evidence or cooperation from victims is a major barrier to prosecution.
Why Does This Matter for Firearm-Related Crime?
These figures reinforce a key theme: even when weapons are involved, prosecutions are rare. That’s often because:
- Firearms or weapons aren't recovered
- Victims are unwilling or afraid to support prosecution
- Eyewitness accounts may be vague or unreliable
- Weapon types vary, making classification difficult
Police Use of Firearms in England and Wales
Police in England and Wales carry out thousands of armed operations each year, but actual firearm discharges remain extremely rare. The latest figures from 2024/25 show 17,249 armed operations, yet in only four of those cases was a firearm discharged.
| Year | Total police firearms operations | Police discharges at incidents |
|---|---|---|
| 2008/09 | 23,181 | 6 |
| 2009/10 | 21,337 | 6 |
| 2010/11 | 19,586 | 4 |
| 2011/12 | 16,930 | 4 |
| 2012/13 | 15,475 | 3 |
| 2013/14 | 14,937 | 3 |
| 2014/15 | 14,685 | 6 |
| 2015/16 | 14,552 | 7 |
| 2016/17 | 15,783 | 6 |
| 2017/18 | 18,781 | 8 |
| 2018/19 | 20,192 | 13 |
| 2019/20 | 19,393 | 5 |
| 2020/21 | 18,245 | 4 |
| 2021/22 | 18,257 | 4 |
| 2022/23 | 18,400 | 10 |
| 2023/24 | 17,589 | 2 |
| 2024/25 | 17,249 | 4 |
| Total | 304,572 | 95 |
- The highest number of operations where police forces have firearms occurred in 2008/09, with over 23,000 incidents.
- The lowest point came in 2015/16, with 14,552 operations. Since then, annual firearms operations have risen to just over 20,000 in 2018/19 before falling to 17,249 in 2024/25.
- Across all years, firearms were discharged in just 95 incidents – an average of fewer than six per year.
- Only 0.03% of armed police operations over 17 years involved a firearm being fired.
- The consistency of low discharge rates, despite thousands of operations involving firearms, suggests the effectiveness of de-escalation tactics and specialist training.
3D Printed Firearms: A New Threat for a New Era of Untraceable Weapon Ownership
3D-printed guns (often referred to as “ghost guns”) are becoming a serious concern for UK law enforcement. These weapons can be built cheaply at home, with basic materials costing as little as £1 to £2. They don’t carry serial numbers, either, making them virtually untraceable by police forces.
While still illegal under the Firearms Act 1968, which bans weapon manufacturing without government approval, loopholes remain. Blueprints are freely available online, and how-to videos can still be found on platforms like YouTube, Facebook, and Instagram.
The government has proposed a new bill to criminalise the possession and distribution of 3D weapon blueprints. But, until legislation catches up, these DIY firearms remain a threat that’s difficult to monitor and even harder to control.
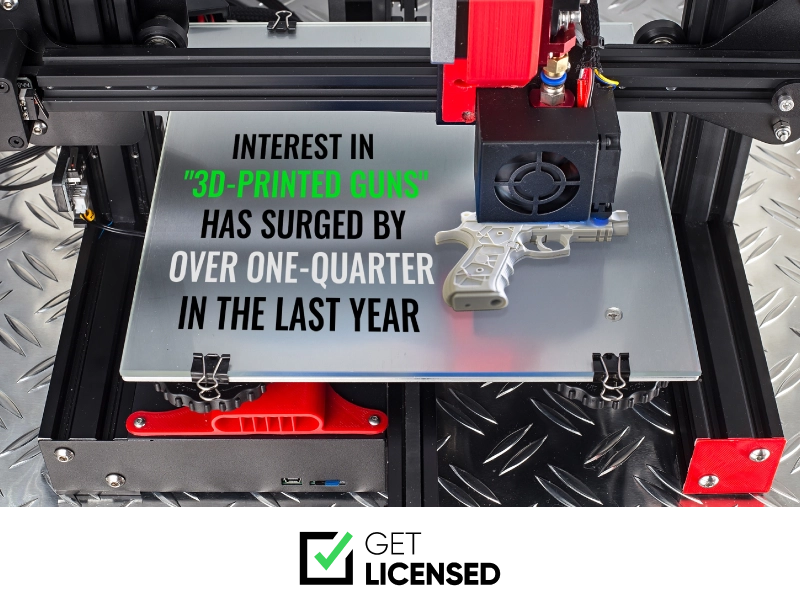
The Rise of 3D-Printed Weapons: Public Interest Surges More Than 25% in One Year
Manufacturing firearms without government approval, including 3D-printed weapons, is banned under the Firearms Act 1968. But with downloadable blueprints and accessible 3D printers, these weapons are becoming increasingly difficult to control.
| Period | UK "3D printed guns" searches | YoY change | Overall change across the period |
|---|---|---|---|
| July 2021 - June 2022 | 19,700 | – | |
| July 2022 - June 2023 | 19,800 | +0.5% | |
| July 2023 - June 2024 | 20,400 | +3% | |
| July 2024 - June 2025 | 25,600 | +25.5% | +29.9% |
UK search interest in 3D-printed guns is rising steadily, with a sharp jump in the past year:
- From 19,700 searches in 2021-22 to 25,600 in 2024-25 – a 30% increase over three years.
- The largest spike occurred in the last 12 months alone, with an increase of over one-quarter (25.5%) year over year.
- Though search volume doesn’t equal weapon production, it does signal growing curiosity around a largely unregulated and untraceable threat, in stark contrast to the UK’s tightly controlled legal firearms systems.
Why Firearm Ownership Matters for Security Professionals
The data in this report paints a clear picture: while legal gun ownership remains tightly regulated, the risks posed by illegal firearms, imitation weapons, and untraceable 3D-printed guns are evolving fast. For security professionals, especially those working in public-facing roles, being able to recognise and respond to these threats is more important than ever.
That’s why SIA training, like a door supervisor training course, or CCTV operator training, goes beyond physical security. It includes modules on conflict management, emergency procedures, and situational awareness, giving frontline staff the tools to stay alert and respond appropriately when a potential weapon threat arises.
And, in an environment where threats are harder to detect and react to in time (whether that’s hidden weapons or fast-evolving risks like 3D-printed firearms), trained security professionals are playing an increasingly vital role in public safety. When stationed at a nightclub door, monitoring CCTV in a shopping centre, or patrolling transport hubs, these individuals are often the first line of defence. Their presence helps prevent escalation, protect the public, and support law enforcement, quietly making our communities safer every day.
As the UK’s leading front-line security training, vetting, and staffing platform, Get Licensed offers SIA (Security Industry Authority) approved training courses to help individuals start working as security guards, CCTV operatives, and door supervisors nationally.
References
- BBC data reveals that the materials needed for 3D-printed firearms could cost as little as £1-2.
- UK Google Search data taken from Semrush is correct as of 5/08/25. For 1,018 relevant keywords, the combined monthly search volume is estimated at 8,960.
- GOV.UK records explain the introduction of a digital marker system to make it easier for GPs to flag a patient who they believe is medically unfit to own a firearm.
- According to the Crown Prosecution Service guidance on firearms, mitation firearms are “any thing which has the appearance of being a firearm (other than such a weapon as is mentioned in section 5(1)(b) of this Act [an weapon designed or adapted for the discharge of a noxious substance]), whether or not it is capable of discharging any shot, bullet or other missile”.
Methodology
As part of an ongoing commitment to improving the UK’s security infrastructure, we sourced and analysed extensive data on firearms certificates, offences, and prevalence to highlight the state of gun ownership in England and Wales.
We used GOV.UK to find the following:
- Number of firearm/shotgun certificates issued
- The year-on-year change in firearms/shotgun certificates
- Certificate holders by age/gender/police force area
- The number of applications that have been refused or revoked
We then sent a freedom of information request to the Home Office and each police force in the UK to find out the age of the youngest shotgun licence holder in the UK.
We then used the Office for National Statistics to find the number of offences involving firearms.
We then used GOV.UK to find the prosecution rates for offences involving firearms.
We used GOV.UK again to find out the number of operations involving a firearm and the number of operations involving a firearm being discharged.
We used Google Keyword Planner to find the number of searches for “3D-printed guns” over the last four years and Semrush to find the total number of UK searches for a relevant set of keywords relating to 3D-printed guns.
To support the data included in this report, we also cited information from the references mentioned above.
Launch your career as a
Security Guard in the UK
Learn how to start your career in UK security industry.
Explore Courses


Find work, try mock tests and book courses from
the UK’s #1 app for security professionals


Get Licensed helps you get SIA trained, licensed, and ready for real security jobs — trusted by 450,000+ people across the UK.


