
 Trustpilot


POPULAR COURSES

ALL COURSES
- L2 Award for Cash And Valuables In Transit (CViT)
- Security Drone Pilot
- Security Screening BS7858
- SIA CCTV Operator Training
- SIA Close Protection Training
- SIA Door Supervisor Training
- SIA Security Guard Training
- SIA Top-Up Refresher Training for Close Protection
- SIA Top-Up Refresher Training for Door Supervisor
- SIA Top-Up Refresher Training for Security Guard
- Use of Mechanical Restraints (Handcuffs) - L3 Award
POPULAR LICENCES
ALL LICENCES
- Cash and Valuables in Transit (CVIT) Licence
- CCTV Licence
- Close Protection Licence
- How to get an SIA Licence
- Key Holding Licence
- Security Guard Licence
- SIA Door Supervisor Licence
- SIA Licence Bangladesh Passport
- SIA Licence Ghanaian Passport
- SIA Licence Indian Passport
- SIA Licence Irish Passport
- SIA Licence Nigerian Passport
- SIA Licence on Pakistani Passport
- SIA Licence Poland Passport
- SIA Licence Romanian Passport
- SIA Licence South African Passport
POPULAR COURSES
ALL LOCATIONS
- Andover
- Ashford
- Aylesbury
- Barnsley
- Basingstoke
- Belfast
- Birmingham
- Birmingham-Central
- Birmingham-Central Tyseley
- Birmingham-Edgbaston
- Blackburn
- Bournemouth
- Bradford
- Brentwood
- Brighton
- Bristol
- Burnley
- Bushey
- Cambridge
- Cardiff
- Carlisle
- Chatham
- Chelmsford
- Cheltenham
- Chester
- Colchester
- Coventry
- Crawley
- Crawley-Central
- Derby
- Dundee
- Durham
- Edinburgh
- Exeter
- Exeter-South West
- Exmouth
- Glasgow
- Gloucester
- Hemel Hempstead
- Hereford North
- Hull
- Ipswich
- Leeds
- Leicester
- Leicester-City Centre
- Liverpool
- London-Acton
- London-Aldgate
- London-Barnet
- London-Beckenham
- London-Bermondsey
- London-Bromley
- London-Central
- London-Chigwell
- London-Clapham
- London-Croydon
- London-Ealing
- London-East Ham
- London-Enfield
- London-ExCeL
- London-Finsbury Park
- London-Greenford
- London-Hanwell
- London-Hayes-and-Southall
- London-Holborn
- London-Ilford
- London-Kennington
- London-Kingston Upon Thames
- London-Mile-End
- London-Park Royal
- London-Putney
- London-Ruislip
- London-Russell Square
- London-South Croydon
- London-Tottenham Court Rd
- London-Uxbridge
- London-Wembley
- London-Westminster
- London-Wimbledon
- London-Wood Green
- London-Woolwich
- Luton
- Manchester
- Manchester-Central
- Manchester-Piccadilly
- Middlesbrough
- Milton Keynes
- Milton Keynes-Central
- Newcastle Upon Tyne
- Newcastle upon Tyne- Central
- Newport
- Northampton
- Norwich
- Nottingham
- Nottingham-City Centre
- Nottingham-Derby
- oban
- Omagh
- Peterborough
- Plymouth
- Portsmouth
- Preston
- Reading
- Salisbury
- Sheffield
- Slough
- Southampton
- Stoke-on-Trent
- Swansea
- Swindon
- Telford
- Wakefield
- Watford
- Wiltshire
- Winchester
- Wolverhampton
- Worcester
- Andover
- Barnsley
- Belfast
- Birmingham
- Bolton-Breightmet Street
- Bournemouth
- Bradford
- Brentwood
- Brighton
- Bristol
- Cardiff
- Chelmsford
- Chester
- Coventry
- Derby
- Edinburgh
- Glasgow
- Hereford North
- Leeds
- Leicester
- Liverpool
- London-Central
- London-Chigwell
- London-Croydon
- London-Finsbury Park
- London-Greenford
- London-Holborn
- London-Holborn-Central
- London-Ilford
- London-Kensington
- London-Ruislip
- London-Russell Square
- London-Tottenham Court Rd
- London-Wembley
- London-Westminster
- London-Wood Green
- London-Woolwich
- Luton
- Manchester
- Manchester-Central
- Milton Keynes
- Milton Keynes-Central
- Newcastle Upon Tyne
- Newport
- Northampton
- Norwich
- Nottingham
- Plymouth
- Portsmouth
- Preston
- Salisbury
- Sheffield
- Slough
- Southampton
- Stoke-on-Trent
- Swansea
- Swindon
- Telford
- Wakefield
- Winchester
- Worcester
- Zoom
- Birmingham
- Birmingham-Central Tyseley
- Birmingham-Edgbaston
- Bradford
- Bristol
- Cardiff
- Chester
- Coventry
- Hull
- Leeds
- Leicester
- Liverpool
- London-Aldgate
- London-Central
- London-East Ham
- London-ExCeL
- London-Holborn
- London-Kingston Upon Thames
- London-Mile-End
- London-Russell Square
- London-Tottenham Court Rd
- London-Westminster
- Manchester
- Newcastle Upon Tyne
- Newport
- Nottingham-City Centre
- oban
- Portsmouth
- Reading
- Reading-City Centre
- Sheffield-City Centre
- Slough
- Stoke-on-Trent
- Andover
- Ashford
- Aylesbury
- Barnsley
- Basingstoke
- Belfast
- Birmingham
- Birmingham-Central
- Birmingham-Central Tyseley
- Bolton
- Bolton-Breightmet Street
- Bournemouth
- Bradford
- Brentwood
- Brighton
- Bristol
- Bushey
- Cambridge
- Cardiff
- Chatham
- Chelmsford
- Cheltenham
- Chester
- Colchester
- Coventry
- Crawley
- Derby
- Edinburgh
- Exeter
- Exmouth
- Glasgow
- Gloucester
- Guildford
- Hemel Hempstead
- Hereford North
- Hull
- Ipswich
- Leeds
- Leeds Central
- Leicester-City Centre
- Liverpool
- London-Acton
- London-Aldgate
- London-Barnet
- London-Beckenham
- London-Bermondsey
- London-Bromley
- London-Central
- London-Chigwell
- London-Clapham
- London-Croydon
- London-Dagenham
- London-East Ham
- London-Enfield
- London-ExCeL
- London-Finsbury Park
- London-Greenford
- London-Hayes-and-Southall
- London-Holborn
- London-Holborn-Central
- London-Ilford
- London-Kennington
- London-Kensington
- London-Kingston Upon Thames
- London-Mile-End
- London-Park Royal
- London-Putney
- London-Romford
- London-Ruislip
- London-Russell Square
- London-Stratford
- London-Tottenham Court Rd
- London-Uxbridge
- London-Wembley
- London-Wimbledon
- London-Wood Green
- London-Woolwich
- Luton
- Manchester
- Manchester-Central
- Manchester-Piccadilly
- Middlesbrough
- Milton Keynes
- Milton Keynes-Central
- Newcastle Upon Tyne
- Newcastle upon Tyne- Central
- Newport
- Northampton
- Norwich
- Nottingham
- oban
- Oldham
- Peterborough
- Plymouth
- Portsmouth
- Preston
- Reading
- Salisbury
- Sheffield
- Slough
- Southampton
- Southend On Sea
- Stoke-on-Trent
- Swindon
- Telford
- Wakefield
- Watford
- Wiltshire
- Winchester
- Woking
- Wolverhampton
- Worcester
- Andover
- Birmingham
- Bolton-Breightmet Street
- Bournemouth
- Bristol
- Cardiff
- Chester
- Coventry
- Derby
- Glasgow
- Hereford North
- Leeds
- Leicester
- Liverpool
- London-Aldgate
- London-Brixton
- London-Central
- London-East Ham
- London-ExCeL
- London-Finsbury Park
- London-Holborn
- London-Kensington
- London-Mile-End
- London-Russell Square
- London-Tottenham Court Rd
- London-Wood Green
- Manchester
- Newcastle Upon Tyne
- Newport
- Nottingham
- oban
- Portsmouth
- Salisbury
- Sheffield
- Slough
- Southampton
- Telford
- Winchester
- Worcester
ALL CAREERS
- ARC Operator
- Area Relief Security Officer
- Close Protection Officer
- Control Room Operator
- Corporate Security Officer
- Distribution Security Officer
- Front of House Officer
- Key Response Officer
- Loading Bay Supervisor
- Mobile Security Supervisor
- Night Shift Security Officer
- Nightclub Doorman
- Retail Security Officer
- Security Command Centre Manager
- Security Concierge
- Security Manager
- Security Patrol Officer
- Static Security Officer
- Venue Security Officer

The Safest Cities in Britain: Where Are Crime Rates Lowest and Highest?
by Get Licensed | Aug 22, 2025 | Reading Time: 10 mins
Looking for Britain’s safest cities, or the places where crime bites hardest?
We’ve compared police-recorded crime with year-on-year change in crime severity, reoffending, and antisocial behaviour, and an FOI-led count of public-space CCTV to rank local authorities across the nation.
We’ve also found the places with the highest density of security professionals, and where there could be potential supply gaps of licence holders who have completed certified coaching, such as an SIA CCTV course or SIA door supervisor training.
Key Takeaways From Our Research
-
Sutton is the safest place in Britain,
with an annual crime rate of 61.0 per 1,000 people and the highest safety score of 8.09/10. Crime also fell 2.75%
year over year. - Camden is the most dangerous place in Britain, with almost 195 offences per 1,000 people, and nearly a third of criminals going on to reoffend.
- Bath & North East Somerset has had the highest increase in crime, up 15.93% year-on-year (to 81.1 offences per 1,000 people).
- Barking & Dagenham has reduced its crime levels most significantly, down 10.03% over the last year (to 89.4 offences per 1,000 people).
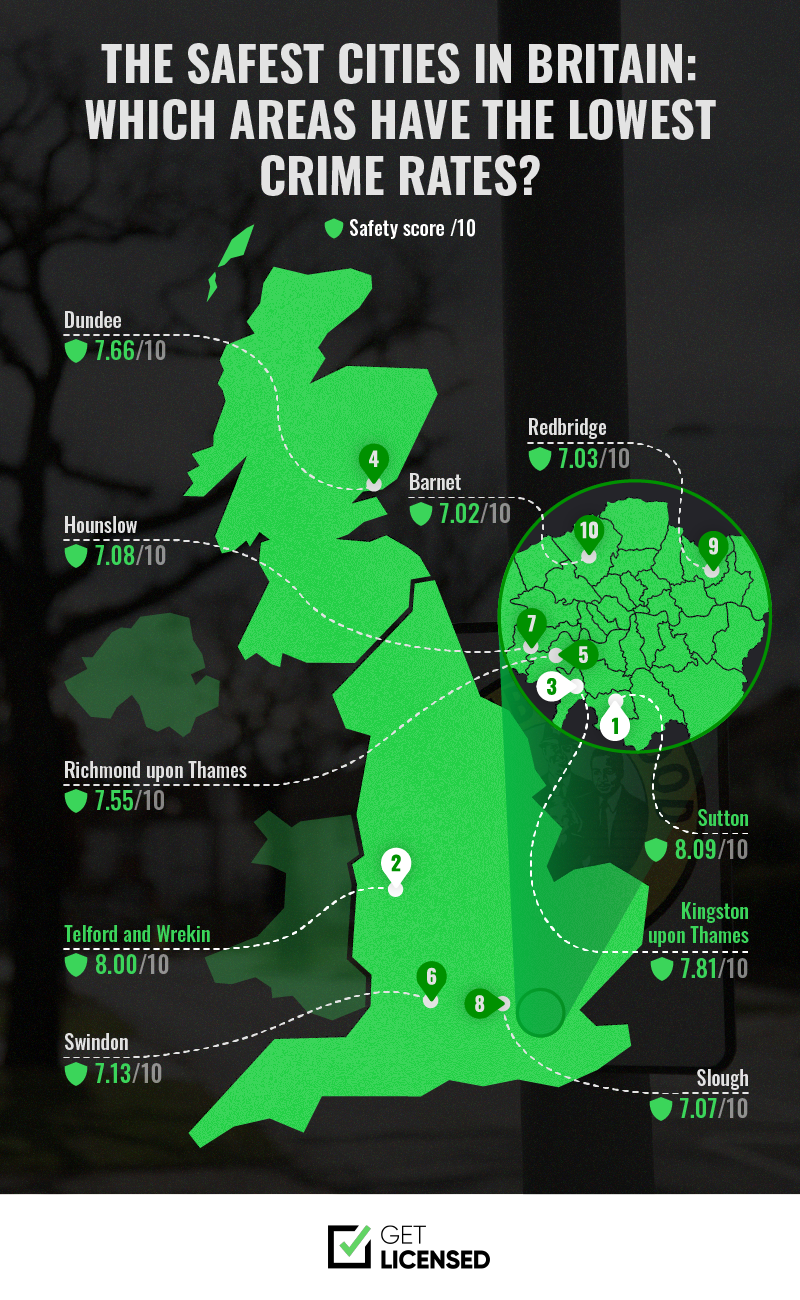
The Safest Cities in Britain: Which Areas Have the Lowest Crime Rates?
We collected data on various safety factors, such as the number of offences, public CCTV cameras, and the reoffending rate, to find the areas with the lowest crime rates in Britain.
| Rank | Local Authority | Safety Index /100 | Annual Crime Rate per 1,000 People | Year-on-Year Change in Crime | Public CCTV Cameras Per 100,000 People | Crime Severity Score | Reoffending Rate | Monthly Anti-Social Behaviour Rate per 1,000 People | Safety Score /10 |
|---|---|---|---|---|---|---|---|---|---|
| 1 | Sutton | 47.06 | 61.0 | -2.75% | 230 | 11.9 | 15.74% | 1.32 | 8.09 |
| 2 | Telford and Wrekin | 63.16 | 76.5 | -7.53% | 533 | 18.0 | 19.61% | 1.38 | 8.00 |
| 3 | Kingston upon Thames | 74.81 | 67.1 | -9.69% | 350 | 14.3 | 21.89% | 2.00 | 7.81 |
| 4 | Dundee | 51.66 | 78.3 | -6.38% | 342 | - | 25.70% | 0.83 | 7.66 |
| 5 | Richmond upon Thames | - | 61.7 | 0.91% | - | 9.8 | 18.83% | 1.55 | 7.55 |
| 6 | Swindon | 49.33 | 66.6 | -5.04% | 461 | 12.4 | 31.15% | 1.41 | 7.13 |
| 7 | Hounslow | 50.74 | 89.6 | -7.28% | 470 | 15.2 | 20.98% | 2.29 | 7.08 |
| 8 | Slough | 35.48 | 90.6 | -8.69% | - | 15.9 | 26.76% | 1.03 | 7.07 |
| 9 | Redbridge | - | 75.9 | -3.83% | 217 | 14.4 | 21.06% | 1.69 | 7.03 |
| 10 | Barnet | 67.06 | 71.3 | -4.24% | 143 | 14.5 | 19.28% | 1.78 | 7.02 |
1. Sutton | Safety Score of 8.09 out of 10
Sutton (postcodes SM1-SM7) is officially the safest place in Great Britain, scoring 8.09 out of 10.
There’s a reassuring level of day-to-day safety in this south London borough, with a low annual crime rate of just 61.0 offences per 1,000 people, a below-average reoffending rate (15.74%) and one of the lowest crime severity scores on our list (11.9).
When there are crimes in Sutton, they tend to be robberies or thefts, with little to no reports of weapons possession.
2. Telford and Wrekin | Safety Score of 8.00 out of 10
Telford and Wrekin (postcodes TF1-TF13) are almost as safe as Sutton, just missing out on the top spot. The crime rate is 76.5 per 1,000 people, lower than many similar-sized places like Hammersmith & Fulham, and has fallen by 7.53% year-on-year.
The area also has 533 public CCTV cameras per 100,000 people, the fourth-highest number of any area in our index. This means that if a crime is committed, it’s highly likely to be caught on camera.
3. Kingston upon Thames | Safety Score of 7.81 out of 10
Tucked away in southwest London, Kingston upon Thames (postcodes KT1-KT24) is often thought of as one of the capital’s safest boroughs and the data only reinforces that reputation.
There’s a crime rate of 67.1 per 1,000 people, second only to Sutton in the London area, where crimes mainly centre around theft. This could be even lower by next year, as the crime rate has dropped by almost 10% year-on-year.
Violent Crime Rates in Britain: How Does It Differ by Area?
The ‘Violence Against the Person’ crime category can refer to several incidents. The offences can range from minor assaults like threats to bodily harm and murder.
| Lowest Rates of Violence | Highest Rates of Violence | |||||
|---|---|---|---|---|---|---|
| Rank | Local Authority | Violence Against the Person Offences per 100,000 People | Rank | Local Authority | Violence Against the Person Offences per 100,000 People | |
| 1 | Isles of Scilly | 10 | 1 | Blackpool | 69 | |
| 2 | Buckinghamshire | 13 | 2 | Middlesbrough | 57 | |
| 3 | Waverley | 14 | 3 | Bradford | 55 | |
The Isles of Scilly wouldn’t be where you’d expect a lot of violence, and you’d be right. These islands see about 10 offences per 100,000, over 149% less than those recorded in Blackpool.
Buckinghamshire has three more offences per 100,000 than the Isles of Scilly, with Waverley adding just one more, whereas Middlesbrough and Bradford have over double that, at 57 and 55 respectively.
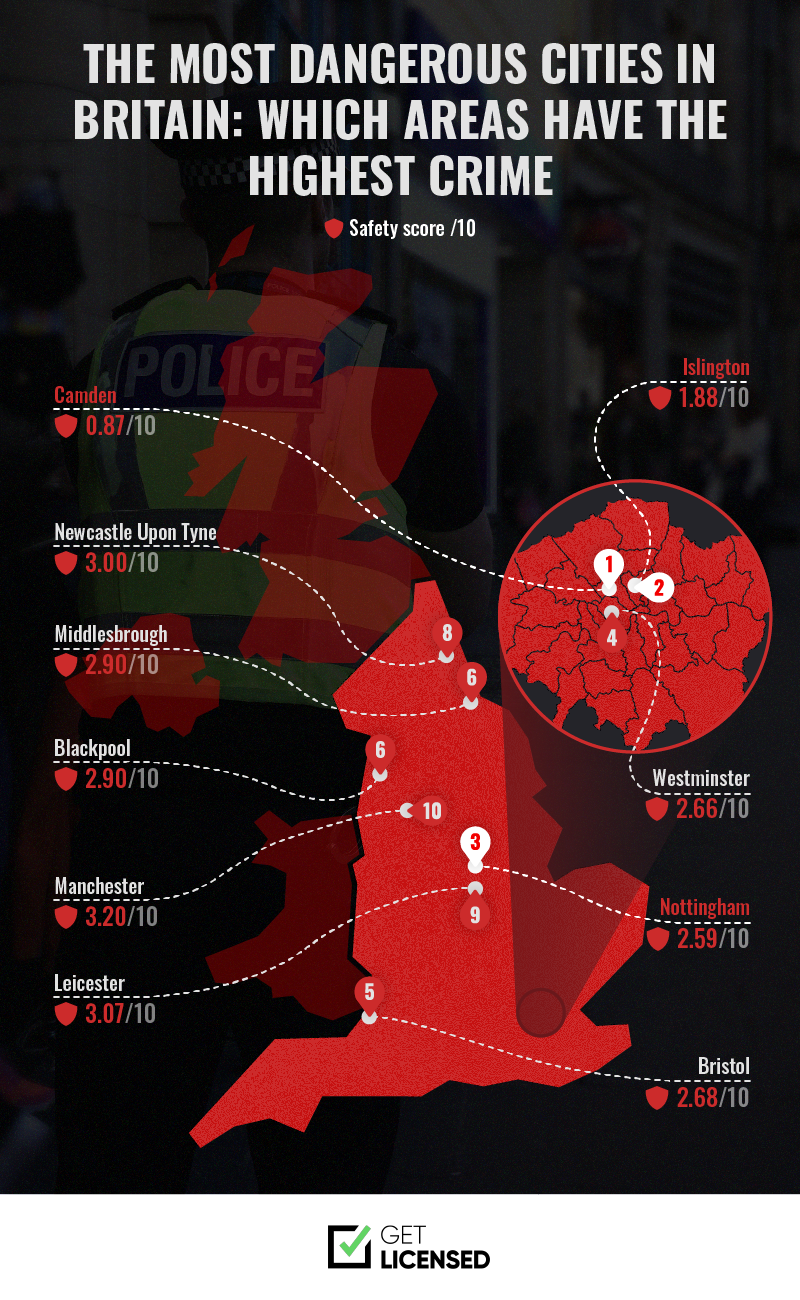
The Most Dangerous Cities in Britain: Which Areas Have the Highest Crime Rate?
| Rank | Local Authority | Safety Index /100 | Annual Crime Rate per 1,000 People | Year-on-Year Change in Crime | Public CCTV Cameras Per 100,000 People | Crime Severity Score | Reoffending Rate | Monthly Anti-Social Behaviour Rate per 1,000 People | Safety Score /10 |
|---|---|---|---|---|---|---|---|---|---|
| 1 | Camden | - | 194.8 | 3.67% | - | 28.1 | 30.75% | 3.98 | 0.87 |
| 2 | Islington | - | 140.8 | 8.10% | 79 | 25.0 | 26.02% | 3.58 | 1.88 |
| 3 | Nottingham | 48.49 | 118.4 | -2.33% | 87 | 23.2 | 31.59% | 2.35 | 2.59 |
| 4 | Westminster | 42.35 | 423.2 | -5.09% | - | 60.3 | 24.91% | 5.80 | 2.66 |
| 5 | Bristol | 57.19 | 132.3 | 9.37% | 64 | 18.7 | 29.53% | 1.95 | 2.68 |
| 6 | Blackpool | 40.80 | 154.4 | -1.85% | 856 | 29.5 | 29.82% | 5.73 | 2.90 |
| 6 | Middlesbrough | 49.78 | 158.3 | -5.03% | 497 | 35.1 | 39.62% | 3.18 | 2.90 |
| 8 | Newcastle upon Tyne | 61.10 | 116.0 | -4.89% | - | 22.5 | 32.65% | 2.46 | 3.00 |
| 9 | Leicester | 53.65 | 117.6 | -6.30% | 45 | 24.7 | 33.05% | 1.79 | 3.07 |
| 10 | Manchester | 43.98 | 152.4 | -8.37% | - | 34.7 | 30.30% | - | 3.20 |
1. Camden | Safety Score of 0.87 out of 10
While two London boroughs were in the top three safest places, we’re back in the capital for the most dangerous, too. It’s clear that Camden (covering N1, N6, N7, N19, NW1-NW8, EC1, WC1, WC2, W1 and W9 postcodes) faces ongoing public safety challenges, with a score of 0.87 out of 10.
The borough has a crime rate of nearly 195 offences per 1,000 people, the second-highest in our study, and almost a third (30.75%) of these offenders also go on to commit another crime.
When looking at specific crimes, Camden has higher rates of public order offences than the national average, which includes harassment, riots, and violent disorder.
2. Islington | Safety Score of 1.88 out of 10
London is also home to the second least safe place in Great Britain, Islington (covering N1, N4-N8, N16 and N19 postcodes). It's particularly dangerous for robberies and theft, with its rate of 81 incidents per 100,000 people, three times higher than the national average.
Islington’s crime rate isn’t just high; it’s on the rise, too. It has increased by over 8% year-on-year, now sitting at 140.8 offences per 1,000 people. Like Camden, its relatively high reoffending rate and low CCTV coverage (just 79 cameras per 100,000 people) may also play a role in these persistently high crime figures.
3. Nottingham | Safety Score of 2.59 out of 10
Third place is further north, as Nottingham has a safety score of 2.59 out of 10. The city’s (NG1-NG34 postcodes) annual crime rate stands at 118.4 per 1,000 people, earning it a place among the 10 most dangerous places in Great Britain.
Despite this, crime in the city is down 2.33% year-on-year – a modest improvement, but definitely a step in the right direction.
Crime Rates by Type in Britain
Violence Against the Person Rates in Britain
30.2 Offences per 100,000 People
For every 100,000 people in Britain, there are over 30 reports of violence against the person. However, some areas show much higher and lower crime rates than this.
Blackpool doubles this figure, while Middlesbrough, Bradford, Manchester, Kingston upon Hull, and Westminster all report over 50 per 100,000 people.
In good news, over 55% of local authorities in this study have lower reports for these violent crimes.
Sexual Offence Rates in Britain
3.2 Offences per 100,000 People
Sexual offence rates in Britain stand at 3.2 reports per 100,000 people. While numbers may seem low relative to other offences, sexual crimes often suffer from underreporting, meaning the true numbers are likely to be much higher.
Nearly 45% of local authorities had higher sexual offence rates. Westminster and Blackpool both recorded more than twice the national average, with seven offences per 100,000 people, with Lincoln and Middlesbrough reporting six each.
Places like the Derbyshire Dales, East Hertfordshire, and Tunbridge Wells each had two or fewer sexual offences per 100,000 people.
Robbery and Theft Offences in Britain
27.0 Offences per 100,000 People
Theft-related crimes are one of the most common offences across Britain, with 27 reports per 100,000 people. Westminster pulls this up, as its 325 offences are over 12 times the national average. This dwarfs places like North East Derbyshire and Broadland, which had under 10 offences per 100,000 people.
From shoplifting to pickpocketing and burglary, theft can place a significant financial and emotional burden on individuals and businesses.
City centres and high streets are frequent targets, especially in areas with a high population and limited surveillance. However, CCTV systems, proactive monitoring, and investing in professionals with certifications, such as an SIA security licence, can significantly reduce the risk.
England vs Scotland and Wales: How Do Crime Rates Compare?
| Country | Safety Index /100 | Annual Crime Rate per 1,000 People | Year-on-Year Change in Crime | Public CCTV Cameras Per 100,000 People | Reoffending Rate | Monthly Anti-Social Behaviour Rate per 1,000 People |
|---|---|---|---|---|---|---|
| England | 52.46 | 107.20 | -2.33% | 220.71 | 25.93% | 1.98 |
| Scotland | 59.59 | 74.23 | 0.66% | 242.99 | 28.08% | 0.85 |
| Wales | 60.76 | 101.46 | -0.74% | 136.90 | 32.47% | 1.55 |
On the whole, England has a higher crime rate than the averages seen in Scotland and Wales, at just over 107 incidents and nearly two anti-social behaviour reports a month per 1,000 people, as well as a safety index score of under 53.
This suggests lower levels of violence in Scotland and Wales and, therefore, a greater need for more security provisions like CCTV systems and operators in English cities.
However, the year-on-year decrease in the crime rate is also higher, indicating that while English locations tend to see more offences than Scotland or Wales at the moment, we could see this swap in the years to come.
Note that these comparisons should be taken with a pinch of salt. Comparing across nations requires care as Scotland and Wales use different recording systems, which could impact overall rates.
How Are Crime Rates Changing in Britain?
Across Britain, 60 out of 80 local authorities in this study have seen a decrease in crime over the last year, at an average rate of 2.12%.
But where are we seeing the biggest decreases, and where is crime on the rise?
Areas With Rising Crime Rates
| Rate | Local authority | Annual Crime Rate per 1,000 People | Year-on-Year Change in Crime |
|---|---|---|---|
| 1 | Bath and North East Somerset | 81.1 | 15.93% |
| 2 | Hillingdon | 96.6 | 12.94% |
| 3 | Bristol | 132.3 | 9.37% |
| 4 | Edinburgh | 72.8 | 8.98% |
| 5 | Islington | 140.8 | 8.10% |
| 6 | Watford | 86.4 | 7.88% |
| 7 | Oxford | 106.2 | 7.26% |
| 8 | Waltham Forest | 89.9 | 5.75% |
| 9 | Brighton and Hove | 108.7 | 4.17% |
| 10 | Camden | 194.8 | 3.67% |
1. Bath and North East Somerset
Annual crime rate: 81.1 per 1,000 people
Change: Up 15.93% year-on-year
Bath and North East Somerset may be best known for historic architecture and tourism appeal, but the area has also seen the sharpest rise in crime in Britain. While its overall crime rate remains below the national average, this could be a different story in the future, as reported offences rose by nearly 16% year-on-year.
2. Hillingdon
Annual crime rate: 96.6 per 1,000 people
Change: Up 12.94% year-on-year
Located in West London and home to Heathrow Airport, Hillingdon is no stranger to high footfall, which could contribute to a rising crime rate. The area has recorded an increase of just under 13% in crime over the past year, with robbery and theft offences among the most reported.
3. Bristol
Annual crime rate: 132.3 per 1,000 people
Change: Up 9.37% year-on-year
Bristol is another location where crime rates are rising. The student city has seen a year-on-year increase in crime of 9.37%, with a crime rate of 132.3 per 1,000 people. This crime rate is almost 48% higher than that of Bath and North East Somerset.
Areas With Falling Crime Rates
| Rate | Local authority | Annual Crime Rate per 1,000 People | Year-on-Year Change in Crime |
|---|---|---|---|
| 1 | Barking and Dagenham | 89.4 | -10.03% |
| 2 | Kingston upon Thames | 67.1 | -9.69% |
| 3 | Hammersmith & Fulham | 113.6 | -9.45% |
| 4 | Slough | 90.6 | -8.69% |
| 5 | Manchester | 152.4 | -8.37% |
| 6 | Havering | 74.0 | -7.96% |
| 7 | Wolverhampton | 104.4 | -7.95% |
| 8 | Southend-on-Sea | 94.0 | -7.89% |
| 9 | Derby | 104.8 | -7.73% |
| 10 | Telford and Wrekin | 76.5 | -7.53% |
1. Barking and Dagenham
Annual crime rate: 89.4 per 1,000 people
Change: Down 10.03% year-on-year
Crime in Barking and Dagenham has reduced by more than a tenth over the last year, dropping to an annual rate of 89.4 per 1,000 people. The area also has a low reoffending rate (21.95%), which shows that even if someone does commit a crime, they are unlikely to do so again.
2. Kingston upon Thames
Annual crime rate: 67.1 per 1,000 people
Change: Down 9.69% year-on-year
Kingston upon Thames is not only currently one of the safest places in Britain, but crime is also steadily reducing to firmly cement its position. Offences have dropped by 9.69% in the last year, bringing its annual rate well below the national average.
3. Hammersmith & Fulham
Annual crime rate: 113.6 per 1,000 people
Change: Down 9.45% year-on-year
This location is an example of a place that could be on its way to becoming one of the safest in the future. With a crime rate of 113.6 per 1,000 people, Hammersmith & Fulham sits above the national average, but it’s also one of the most improved areas, as crime has dropped by 9.45% year-on-year.
Perceptions on Crime and Safety in Britain
We’ve found the places with the highest crime rates in Britain according to data, but what about how people feel in practice?
| Rate | Local authority | Safety Index /100 |
|---|---|---|
| 1 | Kingston upon Thames | 74.81 |
| 2 | Bexley | 74.02 |
| 3 | Norwich | 73.94 |
| 4 | Bath and North East Somerset | 73.47 |
| 5 | York | 73.25 |
| 6 | Edinburgh | 69.07 |
| 7 | Warrington | 67.43 |
| 8 | Barnet | 67.06 |
| 9 | Swansea | 65.67 |
| 10 | Oxford | 64.38 |
It may not be surprising that people feel safest in Kingston upon Thames, as it is one of the top three safest areas and has the highest decrease in crime rates. In particular, people are comfortable leaving their cars unattended without the fear that they’ll be missing when they come back and aren’t concerned that they’ll get attacked while out and about.
Bexley and Norwich don’t seem to worry people, either. There’s a high rate of people in both locations who would happily walk around during the day and night, without thoughts of crime troubling them.
Where Do Britons Feel the Least Safe?
| Rate | Local authority | Safety Index /100 |
|---|---|---|
| 1 | Bradford | 33.36 |
| 2 | Coventry | 35.00 |
| 3 | Birmingham | 35.37 |
| 4 | Slough | 35.48 |
| 5 | Wolverhampton | 36.29 |
| 6 | Bolton | 36.39 |
| 7 | Southend-on-Sea | 37.71 |
| 8 | Lewisham | 39.48 |
| 9 | Blackpool | 40.80 |
| 10 | Westminster | 42.35 |
Although Bradford doesn’t have one of the highest crime rates in Britain, that doesn’t mean people don’t feel unsafe there. The northern city received pretty negative ratings across the board, from worries about being mugged to concerns that crime has been increasing.
Two other busy cities, Coventry and Birmingham, are also among the places Britons feel the least safe. They both share the biggest problem in making people feel uncomfortable, and that’s the use of or dealing drugs.
Which Areas of Britain Have the Most SIA Licence Holders?
Completing an SIA security course means an individual can work in numerous front-line roles, such as a door supervisor, security guard, or CCTV operative.
| SIA Licence Holders | |||
|---|---|---|---|
| Rate | Area | Total | Per 100,000 People |
| 1 | Birmingham | 25,897 | 2,301 |
| 2 | Slough and Heathrow | 24,248 | 2,209 |
| 3 | Bradford | 7,075 | 2,119 |
| 4 | Luton | 10,186 | 2,116 |
| 5 | London | 126,436 | 2,080 |
| 6 | Burnley | 2,045 | 1,902 |
| 7 | Manchester | 31,890 | 1,802 |
| 8 | Ashford | 1,219 | 1,557 |
| 9 | Whitehaven | 571 | 1,413 |
| 10 | Middlesbrough and Stockton | 3,869 | 1,295 |
Security personnel will cluster where the demand is, around busy high streets, transport hubs, airports, stadiums, and nightlife districts. However, the City of London isn’t in the top spot when broken down by population.
Transport-linked areas tend to have more security professionals. Birmingham is in first place, with 2,301 SIA licence holders per 100,000 people, and 25,897 in total. There are also 24,248 licence holders (2,209 per 100,000) in Slough and Heathrow, while Luton has 10,186 licence holders (2,116 per 100,000).
Links Between SIA Licence Holders and Crime Rates in Britain
| SIA Licence Holders | |||
|---|---|---|---|
| Region | Crime Rate per 1,000 People | Total | Per 1,000 People |
| London | 106.4 | 126,436 | 14.1 |
| South East | 73.7 | 64,187 | 6.8 |
| West Midlands | 84.8 | 43,196 | 7.1 |
| Scotland | 54.5 | 14,851 | 2.7 |
| North West | 91.9 | 40,694 | 5.4 |
| East of England | 69.8 | 13,569 | 2.1 |
| South West | 73.4 | 10,534 | 1.8 |
| East Midlands | 78.3 | 12,012 | 2.4 |
| Wales | 82.0 | 9,279 | 2.9 |
| Yorkshire and the Humber | 100.9 | 27,635 | 4.9 |
| North East | 99.5 | 11,718 | 4.3 |
Correlation is not causation. A higher number of licence holders does not increase crime; it usually reflects demand in places with more people, venues, and longer operating hours.
Big populations, major events, and significant transport links often equate to more licensed professionals on the ground.
For example, the crime rate in London is over 106 offences per 1,000 people, but as some may expect, this is met with the high density of licence holders (14.1 per 1,000). The West Midlands (84.8 crime rate and 7.1 licence holders per 1,000) and the South East (73.7 crime rate and 6.8 licence holders per 1,000) are in the same boat.
However, there are some potential supply gaps in Britain. Yorkshire and the Humber has a high crime rate (100.9 per 1,000 people) but a comparatively lower security professional density (4.9 per 1,000).

Do Safety Provisions Like CCTV Monitoring Help Reduce Crime Rates?
Places like Hackney and Hammersmith & Fulham (with 1,340 and 1,202 per 100,000 people, respectively) have some of the highest numbers of public CCTV cameras and have seen crime rates reduce over the last year, which can be attributed to wider CCTV coverage.
Meanwhile, Luton and Edinburgh have below 100 per 100,000 people and have seen increases in crime rates year-on-year.
Does this mean the number of CCTV cameras directly impacted the crime rate? It’s difficult to say. But they do often act as a deterrent. If you have a business premises in one of the most dangerous places in Britain and are looking to protect yourself, installing a trustworthy CCTV system won’t hurt to give you peace of mind.
How Qualified Security Staff Can Help Deter Crime
Trained security professionals can help reduce crime in Britain by acting as a visual and physical obstacle for anyone looking to commit theft, bodily harm, or harassment.
Get Licensed. is the UK’s leading frontline security training, vetting, and staffing platform. We provide SIA security training that prepares people for roles as security guards, CCTV operatives, and door supervisors nationwide. We’re proud to contribute to keeping Britain safe by delivering courses such as the SIA door supervisor training and CCTV operator training, which equip professionals with the skills, confidence, and qualifications they need to handle real-world challenges calmly and effectively.
Whether you’re a business aiming to strengthen your security or an individual ready to start a career in the industry, investing in trusted, high-quality training is the first step. Explore our full range of SIA courses and get the training that makes a difference.
Methodology
As part of our commitment to making the nation safer, we sourced extensive data on crime rates, year-on-year changes, public CCTV camera density, and reoffending rate to find the safest and most dangerous places in Britain.
We started by sending a Freedom of Information request to the local councils of the 50 biggest towns and cities outside London and each London borough. Of these, 80 replied with data by August 1st. These 80 local authorities were then given a normalised score out of 10 for the following factors:
Annual crime rate per 1,000 people
Sourced from:
- England & Wales: the Office for National Statistics' Crime in England and Wales: Police Force Area data tables
- Scotland: the Scottish Government's recorded crime in Scotland data
Year-on-year change in crime
The difference in the crime rate for the most recent year available compared to the previous year is sourced from the same sources as above.
Public space CCTV cameras
Sourced from the FOI request outlined above, which was sent to the local councils of the 50 biggest towns & cities outside London, as well as each London borough, with 80 replying with data by August 1st.
Crime severity score
Sourced from the Office for National Statistics' Crime Severity Score (Experimental Statistics)
Reoffending rate
Sourced from:
- England & Wales: the Ministry of Justice's proven reoffending statistics: April to June 2023
- Scotland: the Scottish Government's Reconviction Rates in Scotland: 2020-21 Offender Cohort
Monthly anti-social behaviour rate per 1,000 people
Sourced from:
- England & Wales: LG Inform
- Scotland: the Scottish Government's recorded crime in Scotland data
We also used the Security Industry Authority's to show the number of SIA licence holders per person of working age.
Safety index score
Sourced from Numbeo
All data was collected in August 2025 and is correct as of then.
Notes:
Due to differences in legal systems and recording practices between UK nations, crime rate figures should be treated as broadly indicative rather than strictly comparable.
If any data points were unavailable in a location for any factors, the overall scores were calculated based on the remaining factors. Any areas with missing data for more than one factor were removed.
Launch your career as a
Security Guard in the UK
Learn how to start your career in UK security industry.
Explore Courses


Find work, try mock tests and book courses from
the UK’s #1 app for security professionals


Get Licensed helps you get SIA trained, licensed, and ready for real security jobs — trusted by 450,000+ people across the UK.


